
Linus Torvalds recently explained why ABI (Application Binary Interface) changes are virtually never acceptable in the kernel. He even said that the existing ABI trumps published standards and specifications. He'd rather keep a non-compliant ABI than fix it if even a single user relied on that ABI.
He listed off what he considered to be the valid reasons to change the ABI. In each case, he said, there was a real external reason justifying the change:
Security: in some cases, an ABI has exposed too much information, and that just had to be fixed. Security trumps user convenience.
Implementation: in rare corner-cases, an ABI has just been bad. It's made it into the official kernel, but in a nightmare-Frankenstein way that really didn't work right. Apparently, a bad enough breakage could justify a fix.
Applications: in some cases, an application should have been portable to Linux, but broke because of the ABI. A fix in that case was warranted.
And aside from the security case, Linus felt that it made more sense to maintain a compatibility layer that included the old behavior, just in case anything really did depend on the old ABI. So it would be cruft, but it would be our cruft, and we'd protect it.
Linus closed his e-mail/rant by saying that anyone who intentionally wanted to change an ABI for some reason other than the ones listed above, or because a change crept in accidentally and needed to be reverted, should not work on the kernel or on library development either—harsh.
Dan Luedtke has produced LanyFS, a new minimalist Flash filesystem. The idea is that it would work with anything—even Arduino—and allow quick, easy transportation of files between hardware, without a lot of messing about with file ownership, special permissions or anything like that. The assumption would be that the user had full ownership of everything, which, for regular users, is almost always the case.
There was a lot of initial resistance, because FAT32 traditionally has been the filesystem used on such drives. But FAT32 has a file size limit, and Dan had hit that limit with an Arduino project and wrote LanyFS partly to overcome that.
Meanwhile, exFAT is Microsoft's solution to the same use case. The only problem is, as Carlos Alberto Lopez Perez put it, exFAT was encumbered by patents and licensing fees, which put it out of the running. But, Microsoft might be reluctant to support LanyFS, if it's pushing its own exFAT solution onto users.
As it turns out, Arnd Bergmann also is working on a minimalist Flash filesystem. Although because he was working with a third-party vendor and didn't want to mess up the time frame, he didn't offer any details, except to say that the filesystem would be optimized for Flash.
The appealingly named Unified Extensible Firmware Interface (UEFI) probably will be supported in the Linux kernel at some point. Its purpose is to prevent users from having control of their own systems, so that third-party vendors can run the show. Look it up. It's ugly.
A variety of technical problems are standing in the way of UEFI support. Matthew Garrett recently posted some patches to prevent the root user from modifying the kernel. But, Alan Cox didn't think the kernel alone could guard against the root user successfully. After all, the foundation of Linux security rests on the idea that once anyone gets to be root, that's the ballgame, and so it's more important to try to prevent that from happening, than to try to interfere with root's actions once it did.
I'd say UEFI almost certainly will be part of the kernel. But at the same time, it wouldn't be enabled by default on any system other than those third-party systems being distributed specifically in order to have UEFI enabled. Hopefully, it won't go too far beyond that.
I have a new day job, and as part of the hiring package, I was issued a smartphone. I'm a little bitter that it doesn't include a tethering plan, but that doesn't upset me nearly as much as the lack of Wi-Fi analysis apps. See, my new job issued me an iPhone. I really like the iPhone (it's true, I can't lie), but in order to scan Wi-Fi, I'd have to jailbreak my phone!
Thankfully, the world of Android has no such silly limitation. If you've ever wanted to scan for access points or check signal levels in different parts of your house, WiFi Analyzer is an excellent (and free!) tool. WiFi Analyzer will show currently available access points, graph signal strength as you walk around the house, and even give information on signal quality.
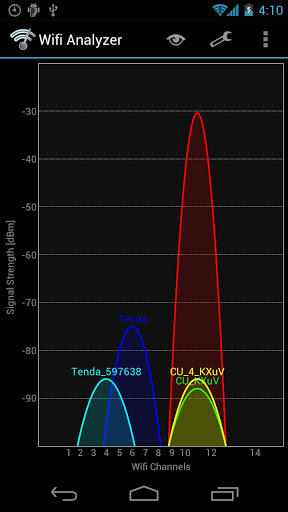
Screenshot from the Google Play Store
I've used WiFi Analyzer to determine the best placement of access points when deploying a building-wide wireless infrastructure. I've used it to pick the best channel for my home access points. I've even walked down the road with it to see what my neighbors use as SSIDs. (That last one might be a little creepy, but really, if people name their wireless networks after Teletubbies, you want to keep an eye on them.)
Because it's incredibly useful, completely free and not available on iOS, WiFi Analyzer gets this month's Editors' Choice award. Check it out at a.farproc.com/wifi-analyzer.
If you're a developer, you've no doubt heard of the SCRUM project development method. In fact, it's very likely you use it. If you're tired of sticky notes on a whiteboard, however, you might want to check out ScrumBoard.
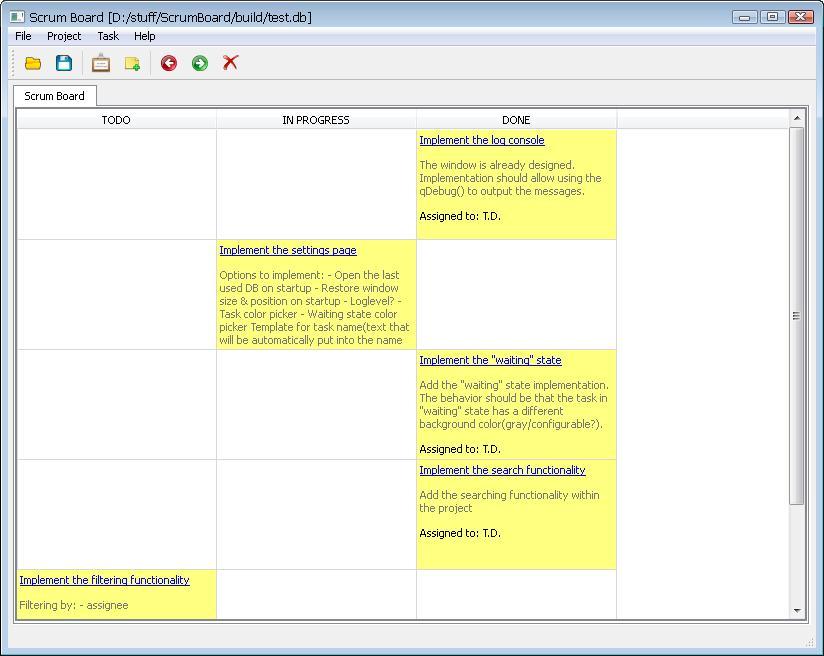
ScrumBoard is an open-source Windows application that provides a digital whiteboard for manipulating project tasks. Tasks can be created, moved and reassigned all inside a completely digital environment. Some people benefit from a physical, visual look at project tasks, but for others, the convenience of a portable digital version is perfect. If you're a SCRUM user, and you're stuck on Windows, check out ScrumBoard: scrum-board.sourceforge.net.
In these columns, I have covered several different scientific packages for doing calculations in many different areas of research. I also have looked at various packages that handle graphical representation of these calculations. But, one package that I've never looked at before is gnuplot (www.gnuplot.info). Gnuplot has been around since the mid-1980s, making it one of the oldest graphical plotting programs around. Because it has been around so long, it's been ported to most of the operating systems that you might conceivably use. This month, I take a look at the basics of gnuplot and show different ways to use it.
Gnuplot is a command-line-driven program. As such, it has been co-opted to provide graphic capabilities in several other applications, such as octave. Thus, you may have used gnuplot without even realizing you were doing so. You can use gnuplot in several ways. It not only can accept input data to plot, but it also can plot functions. Gnuplot can send its output either to the screen (in both a static file format display or an interactive display), or it can send output to any of a large number of file formats. Additionally, lots of functions are available to customize your plots, changing the labels and axes, among other things.
Let's start by installing gnuplot. Binaries are available for many different operating systems. Most Linux distributions also should come with a package for gnuplot, so installation should be a breeze. If you want the latest and greatest features available, you always can download the source code and build gnuplot from scratch.
Once gnuplot is installed, you can start it by executing the command gnuplot. When executed this way, you are launched into an interactive session. Let's start by trying to plot a basic function. You should be able to plot any mathematical function that would be accepted in C, FORTRAN or BASIC. These mathematical expressions can be built up from built-in functions like abs(x), cos(x) or Bessel. You can use integer, real and complex data types as arguments to these functions.
When using gnuplot to generate a plot, you either can have all of the commands in a single file and hand them in to gnuplot as a script, or you can start gnuplot up in interactive mode and issue these commands one at a time in the command environment. To run a gnuplot script, you simply need to add it at the end of the command when you run gnuplot—for example:
gnuplot script_to_run
When you run gnuplot in interactive mode, you can quit your session with the command quit. The two most basic commands are plot and splot. plot generates two-dimensional plots, and splot generates three-dimensional plots. To plot a simple function, you can use:
plot sin(x)/x
This generates a plot window, displaying the graphical results (Figure 1). If you want to add a title to the plot, you can add this option to the plot command:
plot sin(x)/x title "Example 1"
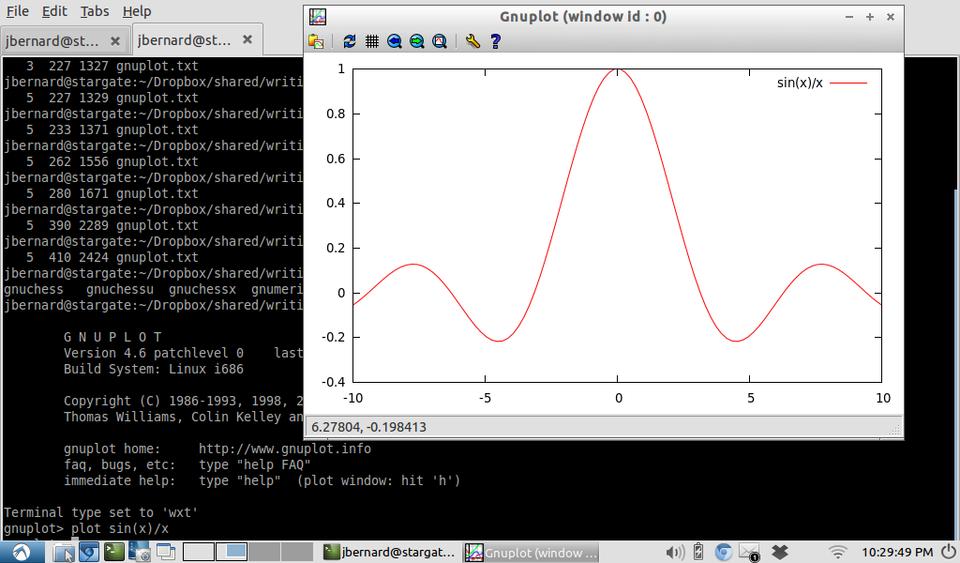
Figure 1. Plotting commands open a new window for display.
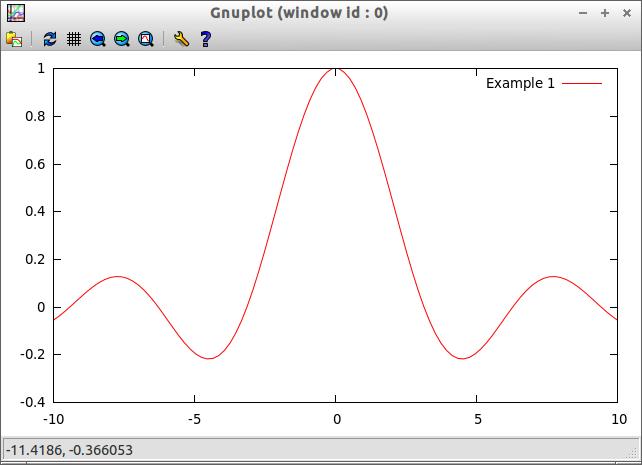
Figure 2. A Basic Plot of sin(x)/x
You even can plot multiple expressions on the same plot window with:
plot sin(x)/x title "Example 1", sin(x) title "Example 2"
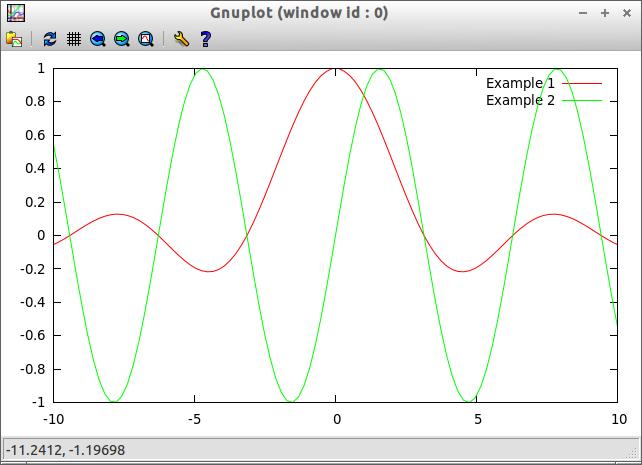
Figure 3. You can plot multiple functions on the same graph.
To plot a three-dimensional graph, simply hand in an expression with two independent variables to splot, such as:
splot x**2+y**2
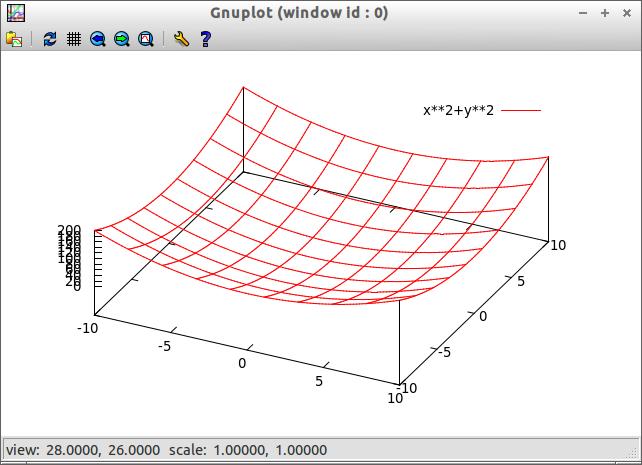
Figure 4. Gnuplot even can handle 3-D plots.
If you run into a problem, the first place to look is the built-in help function. To get help with the plot command, execute the command:
help plot
This pulls up the help documentation that gnuplot has regarding the plot command.
This is fine if you are just trying to see what some expression looks like when it is plotted out, but in real science, you often collect data in experiments that need to be plotted so you can do some graphical analysis and get ideas as to what may be happening. Gnuplot can handle this type of plotting too. To do so, you simply need to hand in the filename of the file containing the data to be plotted. This file should have the data elements arranged in columns, where the columns are separated by white space of some kind. Any lines that start with # are treated as comments by gnuplot and are ignored. If your data file contains several data columns, you can select which columns are pulled in to be plotted as options to the plot or splot functions. As an example, say you have a data file that has the temperature and pressure for each day. You can plot the temperature with:
plot "weather.dat" using 1:2 title "Temperature"
If you want to get the pressure graph, you would use:
plot "weather.dat" using 1:3 title "Pressure"
If you want to plot all three columns, you can use:
splot "weather.dat"
There are two ways of customizing your plots when using gnuplot. The first is to use options to the plot and splot commands. In this case, you define things like the title of the plot, the axes or the style. The styles available can be lines, points, linespoints, impulses, dots, steps, fsteps, histeps, errorbars, xerrorbars, yerrorbars or xyerrorbars. To use one of the styles, you can include the option with the with keyword. So, if you want to plot both the lines and points of your graph, you could add with linespoints to your plot command. You also can use shortcuts for these options. For with, you can use w. For the title option, you can use t. For the using option shown earlier, you can use u.
The second option for customizing your plots is to use the set command. With this command, you are free to set the values for several graphing options. Using the second option, you can set all types of options, like the title, xlabel, yrange, xtics or key, among other options. For example, you can set the y-range with:
set yrange [20:500]
After setting the various plotting options, you need to tell gnuplot to redraw the plot you are working on. You can do this with the command:
replot
Many of these set options also use shortcuts. For example, the shortcut version of the above command is:
set yr [20:500]
Gnuplot is not only a capable utility to plot data and functions, but it also can do some analysis on the data being plotted. For example, you can get gnuplot to do curve fitting on the data. To do so, you first need to define a function, as well as some initial guesses before calling the fit command. An example would look like this:
f1=a1*tanh(x/b1)
a1=300; b1=0.005;
fit f1(x) 'data_file.dat' using 1:2 via a1,b1
This tells gnuplot to try to fit the data from the columns 1 and 2 from the file data_file.dat to the function defined by f1(x).
When you have an environment created for a particular research area, you can save all of the settings you may have set up with the command save. This command essentially saves off all of the gnuplot commands you issued to the text file. This text file can be loaded into a new gnuplot session with the load command. This will take all of the commands saved to the “save” file and re-run them in the new session.
You always can see what options have been set by using the command show. This command shows you what values have been set within the current session. To see all of the options, use the command show all. When you are playing with options, you sometimes can get yourself into an odd condition. Just remember that you always can reset any values created with the set by using the reset command. This command resets these session options to their default values.
Sometimes you may need to interact with the system on which gnuplot is running. In those cases, you need to start a shell session from gnuplot. There are two ways to do so. The first is to use the command system. In this case, you can hand in a string containing the system commands that need to be run outside of gnuplot. The other option is to use the command !. This command actually is just a shortcut for the command system, and the commands can be used interchangeably.
This article has covered only the most basic functions available in gnuplot. It's definitely worth your time to look deeper into the documentation to see what else it can do for you in analyzing your data. Even if you don't use gnuplot directly, learning more about it will help you when you use other applications like octave. Take this article as a jumping-off point and explore just what is possible in data analysis.
The folks over at www.iheartubuntu.com recently put up a challenge to the Linux community to get Netflix to work natively under our beloved OS. Thankfully, Erich Hoover stepped up to the challenge and patched the Wine Project in a way to allow Firefox/Silverlight to be installed and actually work with Netflix's DRM'd Silverlight!
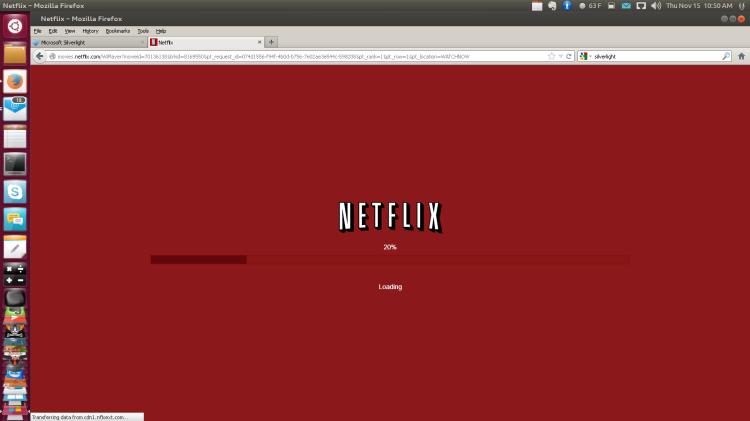
Screenshot from www.iheartubuntu.com
The process is a little complex, and it involves patching source code before compiling, but Erich plans to create a PPA with all the compiling already done. Eventually, he intends to create a standalone Netflix-playing app that incorporates all the pieces of Wine and Silverlight. Thankfully, Erich didn't wait until the project was complete before sharing his success. If you want to play native(ish) Netflix on your Linux desktop without virtualization, check out his instructions at: www.iheartubuntu.com/2012/11/netflix-on-ubuntu-is-here.html.
I find television very educating. Every time somebody turns on the set, I go into the other room and read a book.
—Groucho Marx
If everyone demanded peace instead of another television set, then there'd be peace.
—John Lennon
Television is not real life. In real life people actually have to leave the coffee shop and go to jobs.
—Bill Gates
Watching television is like taking black spray paint to your third eye.
—Bill Hicks
If it weren't for Philo T. Farnsworth, inventor of television, we'd still be eating frozen radio dinners.
—Johnny Carson
I'm often compared to the Absent-Minded Professor. I take it as a great compliment, because in the movie, he's brilliant. Unfortunately, when people refer to me as him, it's the “absent-minded” part they're stressing—not the “professor” part.
During the past few years, I've written about task-management systems, “get things done” digital tools and ways to keep track of to-do lists in Linux. This month, I'm sharing Wunderlist, which is a cross-platform task-management and sharing utility that is truly amazing. When I say cross-platform, I really mean it too. Wunderlist works in Windows, OS X, Linux, iOS, Android, Blackberry, the Web and probably another half-dozen interfaces I've yet to encounter.
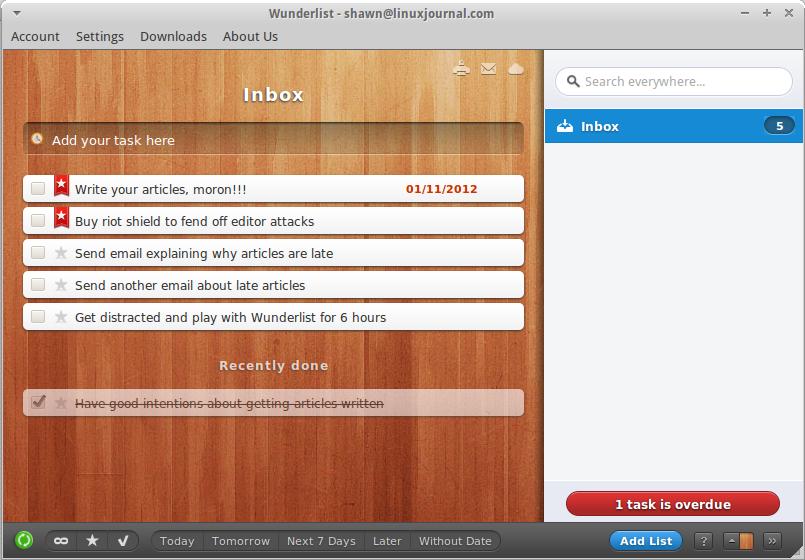
Although it has a robust feature set including task list sharing, due dates, task notes, the ability to drag tasks between lists and keep track of completed items, for me, its real value is in its simplicity. Wunderlist doesn't try to do too much; it just does task lists really, really well. If you haven't seen Wunderlist in action before, put it on your list today: www.wunderlist.com.
