
These two open-source project management tools can help you track your progress on any undertaking.
There is it, François, on page 509 of the Collins dictionary. Enterprise (the focus of this month's issue) is a word that comes from the French word entreprise. You see, mon ami, it is as I told you—a project or undertaking that requires boldness or effort. These days, of course, we often refer to an enterprise as a large-scale business organization. Nevertheless, the definition still stands.
People take on enterprises (or projects, if you will) every day. The success of these enterprises often is tied closely with how the project is managed, how carefully it is planned and how diligently the progress is tracked.
Mon Dieu, François! Why did you not tell me it was so late? Our guests are already here. Bonjour mes amis, and welcome to Chez Marcel, home of fine Linux fare and devastatingly good wine. François! Bring up the 1996 South Australia Coonawarra Shiraz immédiatement!
As I was telling François, mes amis, the focus of today's menu deals with enterprise, the taking on of bold, new projects. Aside from the obvious project management aspects of beginning any enterprise, there seems to be a great deal of excitement when it comes to charting the status of any large project. This usually is done with Gantt charts, which were developed in 1917 by Henry L. Gantt. The familiar horizontal bar chart was developed as a production control tool to provide a quick visual means of determining where and how a project was going, thereby simplifying project management and tracking.
Here's how it works. A Gantt chart's horizontal axis represents the time for the project. This can be broken up into days, weeks or whatever time period makes sense. After all, mes amis, some projects can last an awfully long time. The vertical axis lists tasks that make up the project. For instance, I have been restocking the wine cellar here at Chez Marcel. My task list involves an inventory (François), some amount of shelf reorganization (François), quality control and tasting (Chef Marcel), placing the orders for more wine (François and Chef Marcel), delivery (Henri of Henri's Fine Wines) and finally, restocking (François).
Speaking of François, our esteemed waiter has returned. François, please pour for our guests. You will love this Coonawarra Shiraz, mes amis. In addition to the traditional spiciness of the Shiraz, notice the chocolate in its bouquet, perhaps even a little mint, non? And the taste...but I digress. I was talking about Gantt charts.
Tasks are listed with horizontal bars of varying lengths (and color perhaps) to represent the amount of time spent on the specific task. At any point in the cycle, you can draw a vertical line from the top of the chart (more or less) to create a report of where the project stands. Simple, non?
Simple is the idea behind the Graphical UI Gantt Chart Generator (originally by Jason R. Govig and Seth Goldstein, now maintained by Glen Stewart). This web-based system for generating Gantt charts is simply a collection of CGI scripts. It is perfect if you are looking for something that allows for easy, network-available charting.
It requires Apache and a couple of Perl modules: CGI.pm and Date::Manip.pm. The easiest way to install these Perl modules is at the command line using CPAN:
perl -MCPAN -e "install Date::Manip"
perl -MCPAN -e "install CGI"
I should tell you that you need to do this as root. If you have never run a Perl CPAN install before, you will be asked a number of setup questions. This only happens once, mes amis--other than that, it is a very smooth process. To use the package, point your web browser to the appropriate URL. On my system, it looked something like this: http://webserver/gantt/.
The source for the Gantt chart package is available at associate.com/gantt. To start, extract the source into your web server's document root:
tar -xzvf gantt-1.0.tar.gz
mv gantt-1.0 gantt
Notice that I immediately renamed the directory to something easier. This can be anything you like. Have a look at the directories under the distribution directory, specifically the one called users. This entire directory must be writable by whatever user you have Apache running under (on my system, the user is www). Look for the user and group in your httpd.conf file.
Some modifications are necessary for two files in particular. The first is variables.pl. The lines to change represent your own site configuration, including the document root (as discussed above), the URL to the chart generator, the admin's name and the admin's e-mail address:
# full path to site on server
$docroot = '/usr/local/apache/htdocs/gantt/';
# URL of site
$wwwroot = 'webserver.yourdomain.dom/gantt/';
# Name of site administrator
$admin = '
# Email of site administrator
$adminEmail = 'your_email@yourdomain.dom';
You'll also need to make one small modification to the dbhelp.pl file, providing it with the path to variables.pl:
# Edit this to point to the location of your
# variables.pl file
require \
'/usr/local/apache/htdocs/gantt/variables.pl';
Finally, your Apache server's httpd.conf needs a small edit. To allow CGI scripts to execute from the gantt directory (which lives under document root), you need something akin to the following paragraph:
<Directory "/usr/local/apache/htdocs/gantt">
    Options ExecCGI
</Directory>
When you restart your web server (apachectl
graceful), you'll be ready to roll.
To use the Gantt chart generator, enter a name into the login field—the form actually asks for an e-mail address, but any unique name will do. If this is the first time through, you'll be presented with a dialog form to enter your name and contact information. After you click the Submit button, you can describe your project and identify the members of your project team.
Next, you'll list the tasks that will bring about the successful completion of your new enterprise. Each line is color-coded and new tasks can be added at any time. With each update of the page, enter the starting and ending week and the individual responsible. When you finally click Submit, the chart is generated automatically (Figure 1).
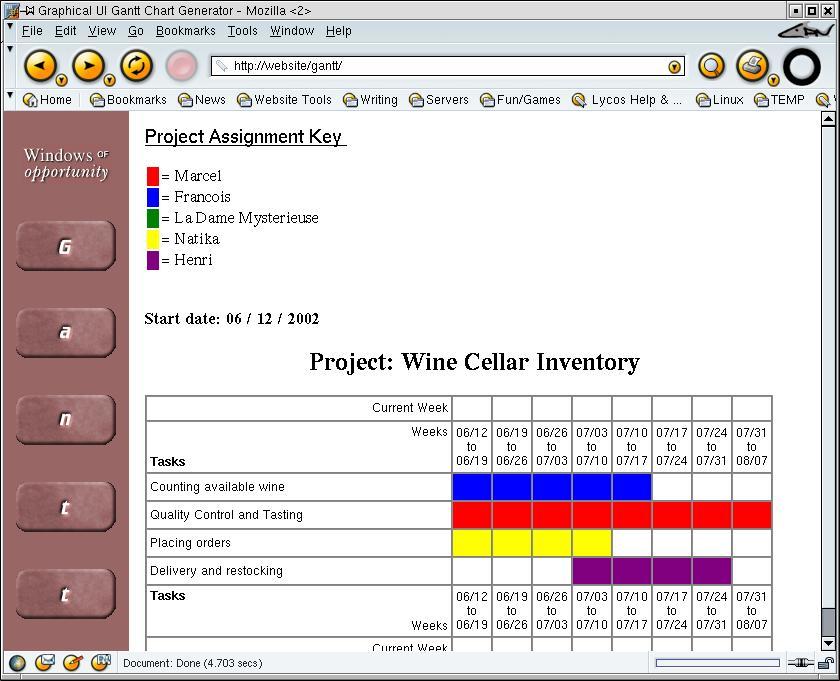
Figure 1. Simple Web Creation of Gantt Charts
Another project well worth your consideration is MrProject (mrproject.codefactory.se). Part of GNOME Office, this is a desktop-centric application. Consequently, you may not have to do anything if you installed GNOME as your desktop (or even if you did not). MrProject can be found on the distribution CDs of the latest Mandrake, Red Hat, SuSE and others.
When you start MrProject for the first time, by typing mrproject &, you open up a blank project. You even can open multiple projects by clicking on New. Notice the buttons on the left-hand side: Resources, Gantt Chart and Tasks. Switching from one view to the other is as simple as clicking the buttons.
When you start your new project, click File on the menubar and select Project Properties. Enter the name of the project, its start date (MrProject has a friendly drop-down calendar to select from), the manager's name and the organization information. Click Close, and save the project under a name that makes sense to you.
Your next step might be to enter the resources you have at your disposal for the duration of the project. You do this by switching to the Resources display and clicking Insert. A default resource record will be added to the list that you can then right-click and edit. A resource might be materials or a person's time. You also can assign cost here.
Under tasks, select Tasks from the sidebar and click Insert once again. As with resources, tasks are generic and need to be edited. These tasks can be described in any way you wish and assigned to one of your resources. Don't worry about the order in which you enter these tasks. You can change the order in the list by selecting a task, then clicking Move up or Move down. The amount of time allocated to a task is entered in days, but you can enter portions of days. The percentage of task completion is also entered here.
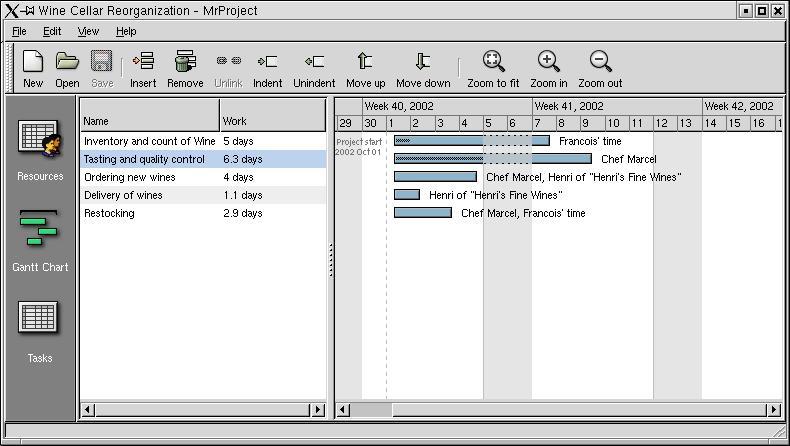
Figure 2. MrProject's Gantt View
At any point, you can switch to the Gantt view (Figure 2). What's cool is that you can modify the time on the tasks by clicking on the horizontal bar and simply dragging it. (I think I need to allocate more time under “Wine tasting and quality control”). Task dependencies also can be added at any time. After all, some tasks require the completion of other tasks before they can be started.
These two are but a few of the packages designed to handle project management, tracking and charting. If you want to see at some of the other available offerings out there, I would highly recommend a visit to the “Call Center, Bug Tracking and Project Management Tools for Linux” page (www.linas.org/linux/pm.html).
Scroll down to the Project Management as well as the Schedulers, Planners and Gantt Chart Tools section for additional packages to explore. Offerings come from both the freeware and commercial software worlds, and each package comes with a brief description along with links to the package's home page.
Looking at the clock, mes amis, it seems as though closing time is nearly here. Perhaps we can take on some enterprise to extend the days by a few hours. With the skills of all the open-source programmers of the Linux world, certainly anything is possible. It is a bold idea, but is that not the meaning of enterprise? At the very least, we shall be able to chart our progress, non?
Speaking of progress, I see your glasses are nearly empty. Let's ask François to rectify this right away. Until next month mes amis, let us all drink to one another's health. A votre santé! Bon appétit!