Analysis Tools for Firewall Logfiles
For the Record
Ralf Spenneberg
Analysis Tools for Firewall LogfilesFor the RecordRalf Spenneberg |
|
In a firewall-protected environment, the administrator must keep track of developments by logging as many transactions as possible. At the same time, admins want to avoid wading through megabytes of logfiles just because they are worried about missing a clue.
Protocal analysis tools provide a solution to this dilemma. Linux users have many options for firewall analysis programs. In this article, we'll look at three alternatives: IPtables Log Analyzer [1], WFlogs from the Wallfire project [2], and FWlogwatch [3]. All three programs support a wide range of protocol formats and serve up the results as neatly formatted HTML pages; WFlogs and FWlogwatch additionally have realtime modes. IPtables Log Analyzer is the only tool to use a database for message storage.
IPtables Log Analyzer relies on a special feeder. Harald Weltes' Ulogd [4] handles this natively, replacing the legacy syslog system. Unfortunately, free analysis tools that support the Ulog database are rare. Ulogd-php [5] is one of the first. In contrast to all other logging systems, Ulogd can log events that caused a firewall alert in its database.
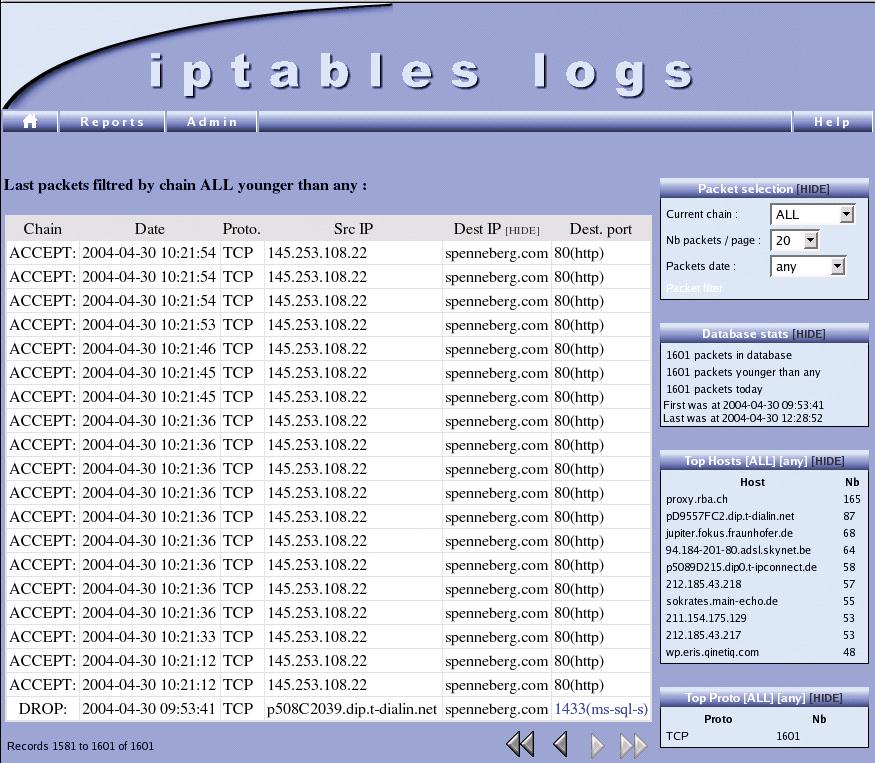
IPtables Log Analyzer serves up IPtables logs for Linux 2.4 or 2.6 in the form of neat HTML pages (see Figure 1). The tool includes three components. The database feeder stores logfile entries in a MySQL database; admins can then use a web interface to access the database. The database feeder, the database, and the web interface can run either on the same machine or on separate machines. In the latter scenario, the database can collect logfiles from multiple firewalls.
After deciding on the architecture, the administrator needs to create a MySQL database called iptables, allow the users iptables_admin and iptables_user access, and generate tables within the database (Listing 1). Of course you also need to define IPtables rules. Two user-defined chains are the best approach (Listing 2).
Instead of -j ACCEPT<$>, IPtables will now use -j LOG_ACCEPT<$>. These modifications are not required for Shorewall [6] or Suse Firewall on CD [7]. This said, Suse will not be supporting its commercial firewall product in the future, which is yet another reason for administrators to choose tools and updates from the world of open source.
The next step is to install the web interface. To do so, the admin user needs to move the web directory to the web server's document root and modify config.php to reflect the database and web server settings (user, password, URL). The final step is to install and enable the database feeder. Again, you will need to modify the database user credentials.
IPtables Log Analyzer has three feeder variants called feed_db.pl, feed_db-shorewall.pl, and feed_db-suse.php. To launch the feeder automatically, the admin user needs to move the start script, scripts/ iptablelog, to /etc/init.d and create links in the rc.
WFlogs is the analysis tool belonging to the Wallfire project [2], although it can be used independently. The modular program parses and processes Netfilter, IPchains, IPfilter, Cisco PIX, Cisco IOS and Snort logfiles, serving up the results as text, HTML, XML, or an interactive realtime mode. WFlogs does not have database support, but it can additionally convert between the Netfilter, IPchains, and IPfilter logfile formats.
Installing WFlogs on Debian is really simple. Debian Sid includes WFlogs, and packages for Woody are available from [8]. Users of other distributions can build WFlogs from the source code. WFlogs also requires the WFnetobjs library, another Wallfire component [2]. The alternative DNS library, adns [9], is also recommended for asynchronous DNS name resolution.
To build WFlogs, follow the typical ./configure; make; make install, steps; you may need to specify the WFnetojbs directory in the configure step.
| Listing 1: MySQL Database |
|
01 # mysql -u root -p 02 mysql> create database iptables; 03 mysql> grant create,select,insert on iptables.* to iptables_admin@localhost identified by `g3h31m'; 04 mysql> grant create,select on iptables.* to iptables_user@localhost identified by `auchgeheim'; 05 mysql> quit 06 # cat sql/db.sql | mysql -u iptables_admin -p iptables |
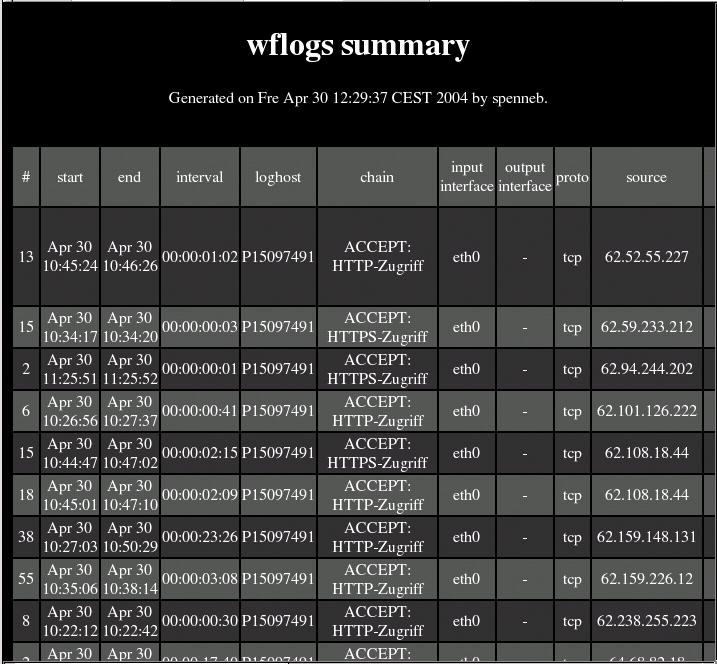
WFlogs can process firewall logs offline or online. The following command creates an HTML-formatted overview from a Netfilter logfile(Figure 2):
wflogs -i netfilter -o html U
netfilter.log > logs.html
In realtime mode, WFlogs analyzes new entries in the logfile and outputs these entries on the screen. Administrators can use a shell to interactively modify WFlogs' behavior. The following command tells WFlogs to monitor a file called /var/log/warn interactively in realtime:
wflogs -RI -o human U
/var/log/warn
The -P option tells WFlogs to process older messages in the file. WFlogs is not thrown by non-firewall messages.
Powerful filtering options can restrict output to specific messages. The following filter is from the WFlogs documentation; it lists denied Telnet and SSH connections for the last three days for the 10.0.0.0/8 network:
wflogs -f '$start_time >= U
this 3 days ago] && $start_timeU
 < [this 2 days ago] && U
$chainlabel =~ /(DROP|REJECT)/ U
&& $sipaddr == 10.0.0.0/8 && U
$protocol == tcp && ($dport == U
ssh || $dport == telnet) && U
($tcpflags & SYN)' -i U
netfilter -o text U
--summary=no
Boris Wesslowski developed FWlogwatch for RUS-CERT at the University of Stuttgart, Germany. Version 1.0 [3] of the analysis tool has now been released under the GPL.
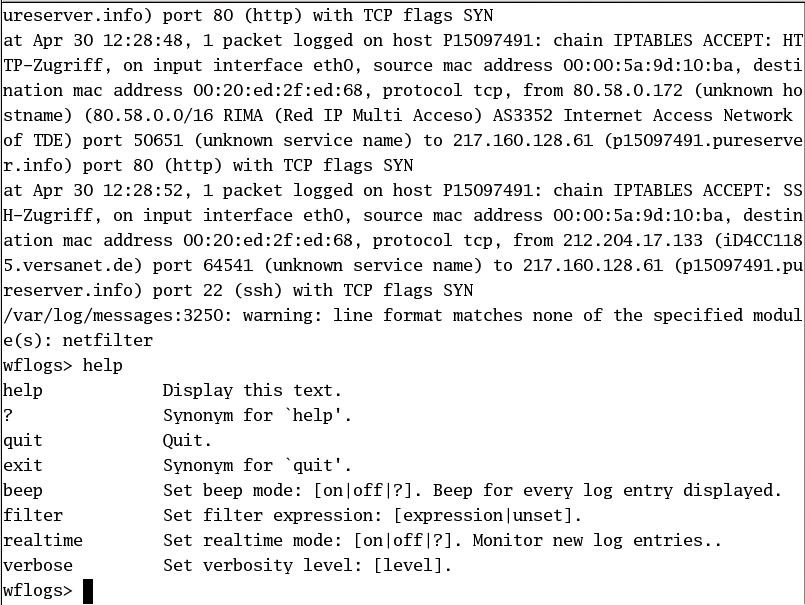
FWlogwatch has three operating modes: Log Summary Mode, Interactive Report Mode, and Realtime Response Mode. In Log Summary Mode, the program generates text or HTML pages with the summaries of the firewall logfile analysis (Figure 3). In Report Mode, FWlogwatch automatically generates incident reports that administrators can then forward to whoever has been affected by the incident.
In realtime mode, FWlogwatch responds to attacks by running scripts, sending email messages, or automatically modifying the firewall rules. Admins can use the integrated web server for browser-based status monitoring of FWlogwatch.
FWlogwatch supports the IPchains (i option), Netfilter (n), IPfilter (f), IPFW (b), Cisco IOS (c), Cisco PIX (p), Netscreen (e), Windows XP (w), Elsa Lancom (l) and Snort (s) formats. The install is a simple make && make install && make install-config process. Boris Wesslowski has packages for Red Hat Linux and Debian on the Fwlogwatch homepage.
Admins can configure FWlogwatch's behavior using the configuration file, which has extremely informative comments. You can also configure FWlogwatch via the command line. The manpage explains the options. For example, the following command launches FWlogwatch in summary mode:
fwlogwatch -b -Pn -U U
'Spenneberg.Com'-p -n -N -o U
output.html -t -w U
/var/log/messages
The -Pn option enables the Netfilter parser. -U<$> allows the user to specify a heading for the summary. The -o<$> option specifies the output file; -w<$> stipulates HTML output. -n<$> and -N<$> enable name resolution for hosts and services. The result is an HTML-formatted summary of the firewall logfiles.
| Listing 2: IPtables Log Analyzer |
|
01 iptables -N LOG_DROP 02 iptables -A LOG_DROP -j LOG --log-tcp-options --log-ip-options --log-prefix `[IPTABLES DROP] : ` 03 iptables -A LOG_DROP -j DROP 04 iptables -N LOG_ACCEPT 05 iptables -A LOG_ACCEPT -j LOG --log-tcp-options --log-ip-options --log-prefix `[IPTABLES ACCEPT] : ` 06 iptables -A LOG_ACCEPT -j ACCEPT |
| Listing 3: Fwlogwatch Realtime Mode |
|
01 realtime_response = yes 02 parser = n 03 run_as = fwloguser 04 recent = 600 05 alert_threshold = 5 06 notify = yes 07 notification_script = /usr/sbin/fwlw_notify 08 server_status = yes 09 bind_to = 127.0.0.1 10 listen_port = 8888 11 status_user = ralf 12 status_password = i0QlAmOg4PrAA 13 refresh = 10 |
The option of running FWlogwatch in realtime mode allows admins to react to logfile messages and simultaneously displays the current status in a browser window. FWlogwatch runs in the background as a daemon and monitors the logfile, reparsing the configuration file if it receives a SIGHUP. SIGUSR1 tells the daemon to reopen the logfile. This feature is useful for rotating logfiles, for example.
Administrators can specify threshold values that define when FWlogwatch will react to logfile messages by launching alerts or response scripts. There are two important configuration options: recent (-l<$>) defines the period of time to monitor, and alert_threshold (-a<$>) defines the number of events within this time scope needed to trigger a response. Listing 3 shows a sample configuration. The example configures FWlogwatch for realtime mode with the Netfilter parser. The process runs under the user ID fwloguser.
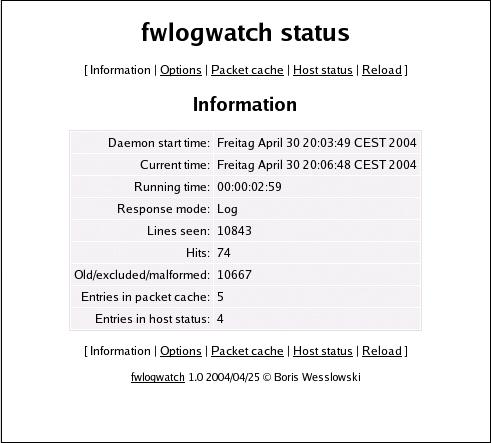
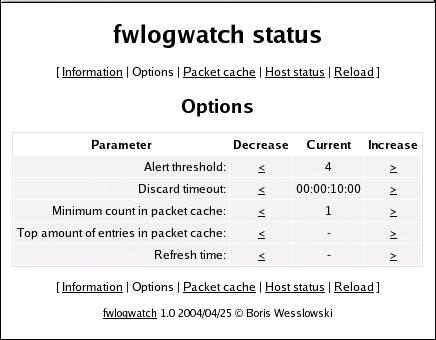
If the threshold of five connections in 600 seconds is exceeded, Fwlogwatch performs a customizable action. Fwlogwatch sets up a web server on 127.0.0.1:8888, where a user ralf can log in with a password of password. FWlogwatch uses DES-encrypted passwords, which you can generate by typing htpasswd -nb user password. When the user logs in to this page, the view shown in Figure 4 appears. This page leads to other pages with a wide range of browser-based Fwlogwatch configuration options (Figure 5).
FWlogwatch has an enormous range of features, from a simple summary to a realtime mode with customizable responses. But the other tools we discussed in this article are well worth considering also. If you need powerful filtering, WFlogs may be a better option for your network. The IPtables Log Analyzer is an interesting choice for some situations because of its database support. The IPTables Log Analyzer gives system administrators the option of using SQL statements to search through firewall messages, rather than having to launch their searches from a web front-end.
| Info |
|
[1] IPtables Log Analyzer: http://www.gege.org/iptables/ [2] Wallfire project (WFlogs und WFnetobjs): http://www.wallfire.org [3] FWlogwatch: http://fwlogwatch.inside-security.de [4] Ulogd: http://gnumonks.org/projects/ulogd [5] Ulogd PHP: http://www.inl.fr/download/ulog-php.html [6] Shorewall firewall: http://shorewall.sourceforge.net [7] Suse firewall: http://www.suse.de/en/business/products/suse_business/firewall/ [8] WFlogs, Debian Woody packages: http://people.debian.org/~kelbert/ [9] GNU adns: http://www.chiark.greenend.org.uk/~ian/adns/ |
| The Author |
|

Ralf Spenneberg is a freelance Unix/Linux trainer and author. Last year saw the release of his first book: "Intrusion Detection Systems for Linux Servers". Ralf has also developed various training materials. |