The Sysadmin's Daily Grind: BootchartBoot CampCharly Kühnast |
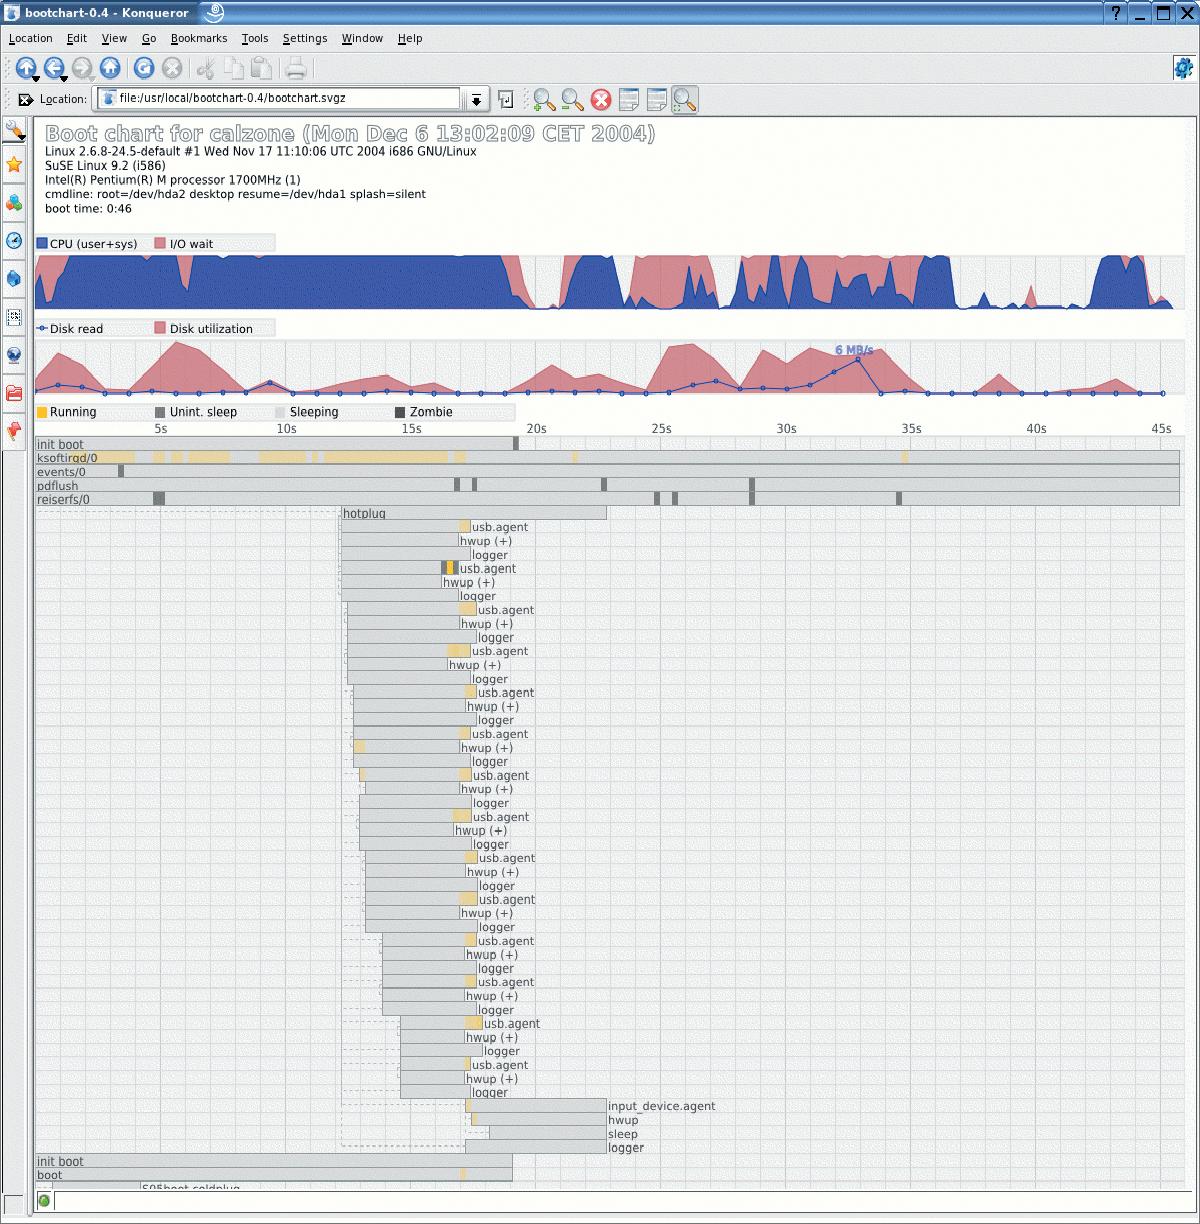
Bootchart [1] runs in the background while a computer is booting, keeping a watchful eye on the hard disk and the CPU load, noting the launch order for daemons, and letting you know if something is causing a delay. After collecting the results, Bootchart presents the relevant information in a user friendly graphic like the chart shown in Figure 1.
Version 0.4 of Bootchart is a 60KB tar archive, which you can quickly unpack by typing
tar xvzpf bootchart-0.4.tar.gz
Now that was quick, or was it? A glance at the readme file reveals that Bootchart needs a Java Development Kit. Fortunately, the tool isn't fussy about your choice of Java; it works fine with GCJ [2], the IBM Developer Kit [3], and Sun's J2SE SDK [4] - I opted for Sun's coffee roaster. I didn't want to do without an I/O load display, so I followed the recommendation in the readme and installed iostat from the sysstat package [5].
The next step is to install the Bootchart logger, that is, the software that actually collects the data at boot time. An install script is provided. The script detects a number of popular Linux distributions and automatically adds the logger. The script is launched by typing ./install.sh in the Bootchart directory. If install does not recognize your distribution, you may need to manually launch the tool.
| SYSADMIN |
|
Radius and 802.1X | 62 We'll show you how to keep unauthorized users off your physical network. Admin Workshop | 66 This month we examine the super server inetd and its successor xinetd. |
The next step is to compile the Java components. If you use GCJ, this is simple: just type make in the Bootchart directory and your work is done. If you opt for the Sun or IBM JDK, your mileage may vary. If you also have Apache Ant on your system, you can simply type the following in the Bootchart directory:
ant
If you don't have Ant, you need a few extra commands:
mkdir build
javac -d build -classpath src
/usr/local/bootchart/Main.java
You may need to change the path in the last command to match the directory where your Bootchart sourcefiles landed after unpacking.
Now that we have finished with the preliminaries, it is time for a test. I rebooted the system to launch the logger and then stopped the logger manually by entering
/etc/rc.d/bootchart/bootlog stop
The path in this command can vary depending on your Linux distribution. A quick ls of /var/log/ revealed two new logfiles, boot.top.log and boot.io.log. These files contain the CPU and hard disk load information from the boot. To create a graphical overview with this data, I then typed
./render.sh
in the Bootchart directory. If render.sh finds an SVG viewer, it will immediately launch the viewer after finishing to show you the results. Time to start hunting for those lost seconds.
| INFO |
|
[1] Bootchart: http://www.klika.si/ziga/bootchart [2] GCJ: http://gcc.gnu.org/java [3] IBM Developer kit for Linux: http://www-106.ibm.com/developerworks/java/jdk/linux140 [4] Sun J2SE SDK: http://java.sun.com/j2se/1.4.2 [5] Sysstat: http://perso.wanadoo.fr/sebastien.godard |
| THE AUTHOR |
|

Charly Kühnast is a Unix System Manager at the data-center in Moers, near Germany's famous River Rhine. His tasks include ensuring firewall security and availability and taking care of the DMZ (demilitarized zone). |