Working with the Perl debugger
Bug Doctor
By Michael Schilli
Working with the Perl debuggerBug DoctorBy Michael Schilli |
|
Linus Torvalds does not like debuggers. In Linus's opinion, it is far too easy to throw a piece of code together and use a debugger to beat some sense into it.
Alternatives to debugging do exist. For instance, the careful application of logging removes the need for debugging in many cases. As you can read at [3], Log::Log4perl helps you integrate an appropriate level of debugging into an application and to remotely control debugging activities.
Sometimes, however, a programmer has no alternative. After all, what are you supposed to do if a program reacts in an unexpected way, the documentation does not give you any clues, and the code (which was written by someone else, of course) is too complicated to follow? Perl has a debugger that quickly locates errors by applying breakpoints, actions, and watchpoints.
Listing 1 shows a practical five liner called wsrv that tells you what kind of web server is hiding behind a specific URL. Calling wsrv http://sun.com, for example, tells you that Sun uses its own technology: Sun Java System Web Server 6.1.
If you want to run the script in the debugger instead, simply start the command line with perl -d, and then add the complete path to the script and its arguments. In this case, you would enter: perl -d wsrv http://microsoft.com. The debugger starts up and asks the user for commands after displaying the first source code "line" (which actually consists of two lines of text):
Loading DB routines from U
perl5db.pl version 1.27
Editor support available.
Enter h or `h h' for help, or U
`man perldebug' for more help.
main::(wsrv:8): my $url = shift
main::(wsrv:9): U
or die "usage $0 url";
  DB<1>
Entering n (for next) at the prompt silently runs the first statement, extracting the URL from the argument array @ARGV and leaving it in $url. Since n only executes a single statement, the debugger stops right afterwards before executing the next line:
DB<1> n
main::(wsrv:10): U
my (@fields) = head($url)
main::(wsrv:11):  U
or die "Fetch failed";
  DB<1>
The next executable instruction is made up of lines 10 and 11 in wsrv. Instead of running the line completely with n, let's use s (for step) instead to take a closer look at what's going on inside the code. As we can see, the debugger dives head first into the head function inside the LWP::Simple module called in line 10:
LWP::Simple::headU
(.../LWP/Simple.pm:70):
70:     my($url)=@_;
The l (for list) command displays the next few lines:
70==>my($url) = @_;
71:    _init_ua()unless$ua;
72
73:    my$request= U
HTTP::Request->U
new(HEAD=>$url);
74:    my$responseU
=$ua->request($request);
[...]
To move downward, without actually executing code, we can simply press l again. The alternative would be to specify a window like l 70+20 (20 lines starting in line 70) or l 70-100 (lines 70 through 100). The next executable line is indicated by ==>.
After scrolling down with l, typing a dot sends the list display back to where the script will continue. Typing r (for return) tells the debugger to proceed running the code until the current function ends and it returns to the main program. Then, it automatically stops:
list context return U
from LWP::Simple::head:
0   'text/html'
1   16144
2   1107018115
3   1107028115
4   'Microsoft-IIS/6.0'
main::(wsrv:9): print U
"Server:$fields[4] \n";
The debugger is so kind as to give us the return values of the head() function immediately prior to displaying the next executable line. If we are interested in the value of the $fields[4] array element, we can use the debugger's p (for print) command to display the value before the print() instruction in the main program does that. p $fields[4] at the prompt gives us Microsoft-IIS/6.0, showing that Microsoft seems to be using its own server technology as well.
To output the contents of the entire @fields array, we could use p @fields, but this would not format the results in a user-friendly way. Fortunately, the debugger's x function handles more complex structures effortlessly:
DB<2> x @fields
0   'text/html'
1   16144
2   1107021419
3   1107031419
4   'Microsoft-U
     IIS/6.0'
The same thing applies to hashes which, for display purposes, we can even define directly within the debugger:
DB<3> %h U
=(donald=> 'duck',
 mickey =>'mouse')
DB<4> x %h
0   'donald'
1   'duck'
2   'mickey'
3   'mouse'
If you want key-value pairs instead of an array type display, simply pass a reference to the hash to x:
DB<5> x \%h
0   HASH(0x837a5f8)
 'donald' => 'duck'
 'mickey' => 'mouse'
Did you notice that the number in the prompt has been incremented? It also appears in the history list, which we can retrieve by typing H:
DB<6> H
5: x \%h
4: x %h
3: %h=(donald=>'duck',U
mickey=>'mouse')
2: x @fields
1: p $fields[4]
To print the $field[4] element again, all we need to do is to type an exclamation mark followed by the number of the history entry !1. That's enough for now - let's move on to tackle more complex tasks.
| Table 1: Debugger Commands | |
| Command | Meaning |
| Controlling program flow | |
| n | Run next line and stop |
| s | Step into next line, stop in subroutine |
| r | Finish current function, return and stop |
| R | Return to start to re-run |
| Displaying variables | |
| p | Output value |
| x | Dump (x \%hash) |
| Source navigation | |
| l | Scroll forwards |
| - | Scroll backwards |
| v | Display the code surrounding the current line |
| . | Go back to current line |
| f | Change to another source file |
| Dynamic navigation | |
| c Line | Run code to this line then stop |
| c Function | Run code to this function and stop in the function |
| b Line | Set breakpoint in line |
| b Function | Set breakpoint in function |
| b Line/Func | Breakpoint with condition condition |
| a Line/Func Action | Action point in line/function |
| w Line/Func code | Watchpoint in line/function variable |
| < Command | Set pre-prompt |
| L | Display breakpoints, watchpoints, actions |
| B/A/W | Delete breakpoints, watchpoints, actions |
| Listing 1: wsrv |
|
01 #!/usr/bin/perl -w 02 ########################### 03 # wsrv - An URL's web server 04 # Mike Schilli, 2004 05 # (m@perlmeister.com) 06 ########################### 07 use LWP::Simple; 08 my $url = shift 09 or die "usage $0 url"; 10 my (@fields) = head($url) 11 or die "Fetch failed"; 12 print "Server: $fields[4]\n"; |
Let's imagine a programmer has just finished a new module called Foo::Bar and wants to prepare the module for a CPAN release. The package includes a file called Makefile.PL (Listing 3), and a file with the lib/Foo/Bar.pm module, which may also include some documention (Listing 2). Calling perl Makefile.PL gives the following slightly cryptic message:
WARNING: Setting ABSTRACT U
via file 'lib/Foo/Bar.pm'
failed at ExtUtils/U
MakeMaker.pmline 606
Confusing, isn't it? Makefile.PL uses the ExtUtils::MakeMaker module, a venerable piece of Perl programming wizardry that is not exactly easy to understand. Again, the debugger allows us to take a peek if we type perl -d Makefile.PL. As the warning points to line 606 in the ExtUtils/MakeMaker.pm file as the source of the error, we need to take a look at the offending line.
The file command, f ExtUtils/MakeMaker.pm, takes us there. We then need to set a breakpoint in line 606 (b 606) to have the debugger stop there later. The c (for continue) command tells the debugger to run the program until the next breakpoint:
DB<2> c
606: push U
@{$self->{RESULT}},
$self->nicetextU
($self->$method(%a));
Instead of setting the breakpoint with b 606 and typing c to go there, c 606 would have run the program and stopped in line 606. But having a permanent breakpoint will come in handy later.
The push command shown in the next source code line above appears to append the result of a call to a method to an array. It might be interesting to find out which method $method calls. p $method can tell us that: It prints post_initialize, which doesn't really give much more insight.
The Perl debugger executes the current line when we type n - but no reaction. n runs the line but we do not get the warning we are expecting. It looks like MakeMaker runs the line multiple times and issues an error when we get to the nth iteration.
Before we type c (continue) to move on to the next iteration (stopping again at the breakpoint in 606), let's define an action point on this line:
DB<3> a <@15_Li_Pfeil_(U)>U
606 print<@15_Li_Pfeil_(U)>U
("$method\n");)
Using a, the line number, and some perl code, the debugger will now output the content of $method every time it executes line 606, even if it is running at full speed. Let's carry on with the continue command:
DB<4> c
   606:push @
{$self->{RESULT}},
$self->nicetextU
($self->$method( %a ));
platform_constants
As we have set a breakpoint in line 606, the debugger stops there in the next round. Because of the action point, it prints the current value of $method, a function named platform_constants. Nothing familiar so far.
But there is still no sign of the warning. Let's delete the breakpoint in line 606 by typing B 606, and ask the debugger to continue the program by typing c:
DB<4> B 606
DB<5> c
[...]
staticmake
test
ppd
WARNING: Setting ABSTRACT U
via file 'lib/somehowU
/anyway.pm' failed
After many rounds of output, it shows that the ppd method causes the warning to finally appear. Unfortunately, the last action went further than we would have liked, but never fear, typing R will allow us to restart the program from scratch. We can now set a new breakpoint for ExtUtils/MakeMaker.pm, line 606, but add a condition this time:
DB<5> f ExtUtils/MakeMaker.pm
DB<6> b 606 $method eq "ppd"
DB<7> c
The debugger will not stop at the breakpoint in line 606 unless the $method variable is set to "ppd". The program launches, stops, and the debugger again shows us the code of line 606. The p $method command confirms that the condition we just specified really has occurred.
We can now use the m command to discover which the methods the $self reference in line 606 is capable of calling:
DB<8> m $self
[...]
via MM -> ExtUtils::MM -> U
ExtUtils::MM_Unix: U
post_initialize U
via MM-> ExtUtils::MM U
->ExtUtils::MM_Unix: postamble
viaMM -> ExtUtils::MM->U
ExtUtils::MM_Unix:ppd
The ppd method is defined in the ExtUtils::MM_Unix module. To troubleshoot this, we need to continue the program with the c command, but stop when ExtUtils::MM_Unix::ppd is triggered:
DB<9> c ExtUtils::MM_Unix::ppd
ExtUtils::MM_Unix::ppdU
(ExtUtils/MM_Unix.pm:U3322):
3322: my($self) = @_;
The debugger is now in the first line of the ppd method, within the ExtUtils::MM_Unix module. After typing l to take a look around, we discover that ppd calls the parse_abstract() method:
DB<10> l
3322==> my($self) = @_;
3323:   if ($self->U
{ABSTRACT_FROM}){
3324:      $self->{ABSTRACT}U
= $self->parse_abstract($self->U
{ABSTRACT_FROM})or
c parse_abstract says to continue and stop in the first line of parse_abstract:
DB<11> c parse_abstract
ExtUtils::MM_Unix::U
parse_abstract(ExtUtilsU
/MM_Unix.pm:3045):
3045: my($self,$parsefile) = @_;
l+20 displays the next 20 lines and the following regular expression which Makefile.PL uses to fetch the abstract from the module in the distribution: 057: nextunless/^($package\s-\s)(.*)/;. Typing w allows us to set a watchpoint for the $package variable to stop the program after typing c whenever the value of $package changes:
DB<2> w $package
DB<3> c
Watchpoint 0: package changed:
old value:  ''
newvalue:   'Foo-Bar'
The parse_abstract() method looks for the regular expression /^Foo::Bar\s-\s)(.*)/. The module name needs to be at the start of the line following a single space and a dash. Since line 3 in listing 2 is indented, with the name following the indent, the extraction fails.
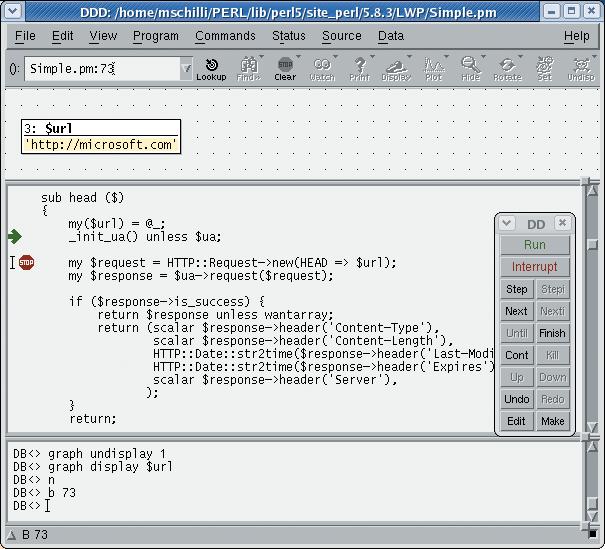
If you prefer a point & click style GUI, you can link the Data Display Debugger ddd with the Perl back-end. ddd ships with all major Linux distributions. The following calls wsrv in ddd to examine the Microsoft homepage:
ddd -perl wsrv U
http://microsoft.com
Figure 1 shows the GUI in action. It facilitates the setting of breakpoints or watching expressions (such as the $url scalar in Figure 1). You could do a similar thing using the pre-prompt command < in the Perl debugger, but some people prefer nicely formatted GUI displays. Alternatives are the commercial IDE Komodo GUI, and the free Ptkdb, which is available from CPAN:
perl -MCPAN -e U
'install(Tk,Devel::ptkdb)'
perl -d:ptkdb wsrv U
http://microsoft.com
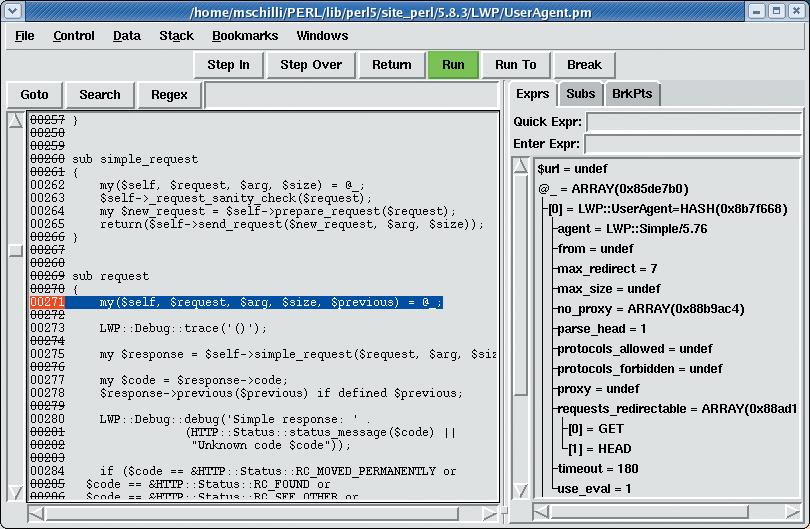
Figure 2 shows Ptkdb iterating through the request method in the LWP::UserAgent package. The right-hand column shows the attributes of the LWP:: UserAgent object, which was passed to the method.
| Listing 2: Sample Module |
|
01 =head1 NAME 02 03 Foo::Bar - Blah blah blah 04 05 =head1 SYNOPSIS 06 07 useFoo::Bar; |
Finally, just a little trick to display each code line as it gets executed by a script. The PERLDB_OPTS environment variable controls the debugger's tracing, just add it to the command line before calling the debugger:
PERLDB_OPTS="NonStop=1U
 AutoTrace=1 frame=2 "U
perl -d Sprogram
The AutoTrace option switches the debugger to tracing mode, where it outputs every line of source code before executing it. The NonStop option tells the debugger not to stop for user input at the beginning or end. frame=2 adds entering and exiting messages on entering and exiting subroutines. If you also need information on any parameters passed and on return values from subroutines, you need to specify frame=4. And finally, the Perl -S option searches the entire $PATH for the script, not just the current directory.
| Listing 3: Makefile.PL |
|
01 #############################
02 # Makefile.PL for Foo::Bar
03 #############################
04 use ExtUtils::MakeMaker;
05
06 WriteMakefile(
07   'NAME' => 'Foo::Bar',
08   'VERSION_FROM' =>
09     'lib/Foo/Bar.pm',
10   'PREREQ_PM' => {},
11   ( $] >= 5.005
12     ? (
13       ABSTRACT_FROM =>
14         'lib/Foo/Bar.pm',
15       AUTHOR =>
16     'Ed Jones <ed@jones.com>'
17       )
18     : ()
19   ),
20 );
|
Each new Perl distribution comes with a short introduction to the art of debugging, perldoc perldebtut displays the manual page. perldebug gives you more detailed documentation, and if you really want to get to terms with the nitty gritty of the debugger, check out perldebguts.
Also, picking up a copy of [2] at your local bookstore is highly recommended if you want the ultimate reference to the Perl debugger.
| INFO |
|
[1] Listings for this article: http://www.linux-magazine.com/Magazine/Downloads/54/Perl [2] Richard Foley, "Perl Debugger Pocket Reference": O'Reilly 2004 [3] Michael Schilli, "Retire your Debugger, log smartly with Log::Log4perl": http://www.perl.com/pub/a/2002/09/11/log4perl.html [4] Peter Scott and Ed Wright: "Perl Debugged", Addison-Wesley 2001 |