By Carsten Möhrke
The choice of an integrated development environment is often a matter of taste. Many PHP developers prefer text editors like Emacs or Vim. Developers who favor a more integrated approach have several choices in the Linux world. The free Quanta Plus IDE, the closed source Maguma environment, and even Eclipse (with the right set of plug-ins) are all genuine alternatives to an editor. For PHP developers, Zend Studio has the reputation of being one of the most mature and powerful IDEs.
Zend Studio is the brainchild of Israel's Zend Software, a vendor that prefers to be known as "The PHP Company." Older versions often suffered from performance problems or instability, but the latest version, Zend Studio 4, is an extremely powerful and stable developer environment. Zend Studio is neither Open Source, nor is it free of charge, although US$ 249 is a fair asking price. You can download a trial version from the Zend website. The test version is full-featured for the 21 day trial period and then degrades to the "Zend Studio Personal Edition," a non-commercial version that disables so many useful features it is not really worth the effort (see the box titled "Zend Studio Personal Edition").
| Zend Studio Personal Edition |
|
The following features are not available in Zend Studio Personal Edition:
|
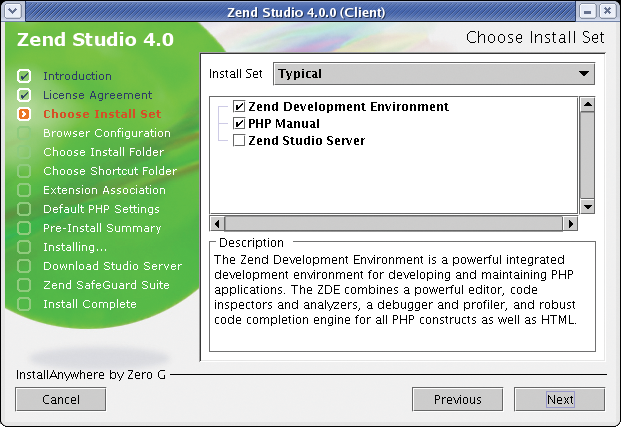
After downloading and unpacking the 47MByte archive, you can launch the installation program directly. A wizard prompts you for a few required details. Besides the typical questions concerning directories, you can say which PHP version you want Zend to support (4 or 5). PHP 4 and 5 are not one hundred percent compatible and have different command sets, so this selection will influence syntax highlighting and checking. The good news is that you can change your mind later. Another important part of the installation is deciding whether to install Zend Studio Server (Figure 1.) Say yes, because you will need the server for effective debugging later.
After completing the installation, Zend Studio automatically detects your system's language settings and launches with the correct language support. At this time of writing, the environment supports English, French, German, Russian and Spanish.
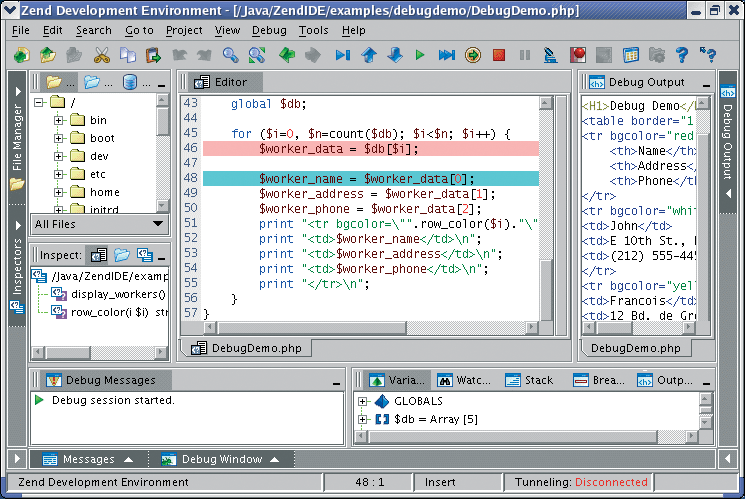
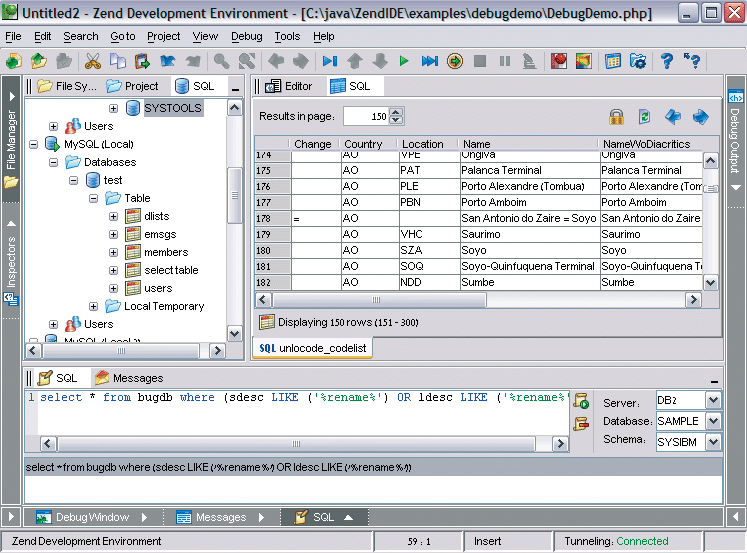
The user interface (Figure 2) is divided into a number of panels. The top left area shows files, servers, and databases for direct access. Below this are various inspectors that give developers a quick overview of the files, classes, and methods belonging to the current project. The lower part of the screen is reserved for messages and the debugging window. The second window gives you information on variable values, the call stack, and similar things. On the right is a display area that gives you the "screen output." This area provides an at-a-glance overview of the output the script generates. Zend Studio also displays the HTTP headers; this is a useful feature, and one that a browser would not give you. Finally, the editing window is at the center of the screen. Good news for those of you worrying where to put all those panels on a small screen: you can scale panels and hide any you do not need.
Before you start using Zend Studio for production, you will probably need to tweak a few settings. The dialog box for personalizing the system is titled Preferences and is launched by selecting Preferences in the tools menu.
Many of these settings are a matter of personal preference. However, there are a few additional options that you will need to change to give you a useful developer environment. For example, you can define how to display the tabulator in the Editing tab. The Newline format can also be important; this setting specifies whether a newline is represented by a carriage return and line feed (Windows standard) or just by a line feed (Unix standard).
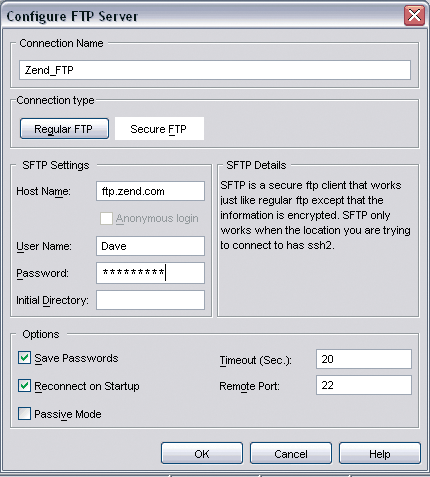
In many cases, you will need to work on files stored on a server. The Zend IDE gives you the ability to store files directly on the server using an FTP connection. You can use SFTP or FTP over SSH for more security if necessary. The file menu takes you to the dialog where you can set up a new server connection (Figure 3.) To set up a connection, you need to supply the usual information, such as the host and user names and a password. Make sure you uncheck the Reconnect on Startup option or Zend Studio will attempt to connect to the server when you launch the IDE, and this can be really annoying if you have a long list of servers, or if connections are down. Zend Studio also has CVS support, which you can again configure through the tools menu.
Direct access to database servers is a new feature in Zend Studio 4. Clicking on SQL in the file management window (top left) displays a list of configured servers. Of course, the list will be empty if you have just finished installing the program. To populate the list, right click in the window and select "Add Server" to open the window shown in Figure 4.
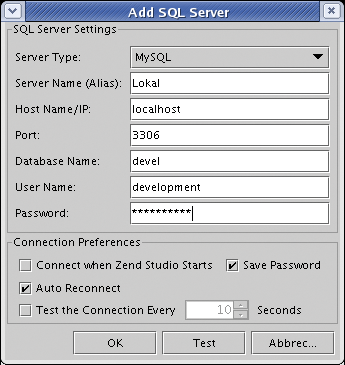
Currently, Zend Studio supports direct access to the following database servers: Oracle, SQLite, Microsoft SQL Server, PostgreSQL, and MySQL. After entering your access credentials, you can immediately access the server. Right clicking opens a connection and gives the developer environment access to any databases, tables, and records for which the current user has permissions.
Developers can view the table structure or content in the window normally occupied by the editor. Zend Studio does not support direct record manipulation, however, as it does not claim to be a database front-end. In database mode, you can use the lower part of the interface to enter SQL commands (Figure 5). This feature allows developers to verify SQL queries before adding them to the PHP codebase.
Although Zend Studio does allow you to edit individual files, developers will more typically want to work on projects. When you add a new project by selecting New Project in the Project menu, a wizard pops up to prompt you for the project name, the path for storing the project files, and the debugging preferences for the project. After you create a project, the new project is displayed on the left in the Project Inspector area. You can now right click or use the File menu to add files to the project.
Zend Studio has several useful features to support encoding work. Besides syntax highlighting, which even the most simple of editors now support, automatic code completion is probably one of the most useful tools. While you are typing, Zend Studio shows a list of functions, variables, or other items that start with the letters you have typed.
Considering the number of PHP commands, the fact that the system gives a short overview of what each function actually does is very useful. A parameter list appears when a function has been uniquely identified.
Zend Studio dynamically adds any functions, variables, and classes you define to the code completion list. This is not restricted to the file you are currently editing, but also includes any other files you have open at the same time. (The code completion feature can lead to confusion when Zend offers you a class from an open file that is not part of your current project.)
As PHP does not support variable type declarations, Zend Studio has no way of knowing what data type a parameter you pass to a function should represent. However, developers can add documentation blocks (docblocks) to provide this information for their own functions, classes, and methods. To do so, right click on a function in the Project Inspector and select Add description to insert an empty docblock.
The first line should be a short description of the function, which will also appear in the code completion help. Docblocks are tag extensible, allowing them to describe the properties of a function or class. Tags always start with @. A tag needs to be preceded with an asterisk (*) and a blank. For example, an entry such as @return: would describe the return type for the function. The @param: tag refers to a parameter. You need a separate entry for each parameter, followed by the variable name and the data type. You'll find a complete list of tags at [1].
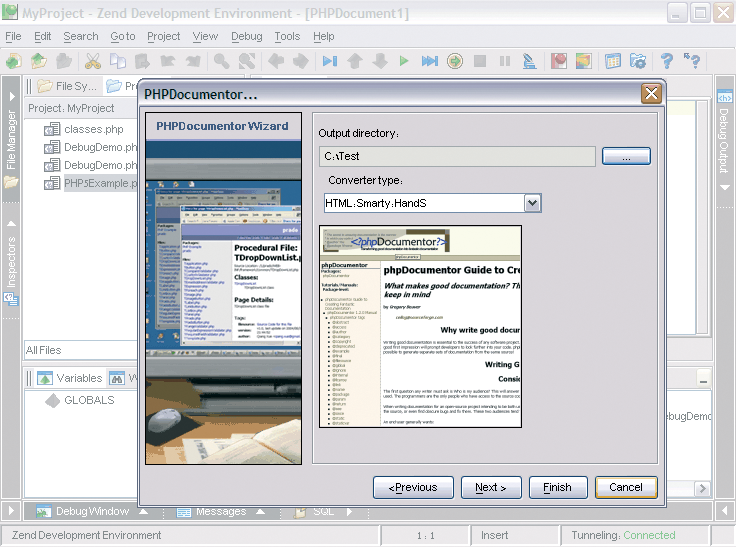
This approach may seem a little complex at first, but it makes sense, as docblocks can be really handy when it comes to automatically generating program documentation. To help you with this chore, Zend Studio has the PHPDocumentor below the Tools menu (Figure 6.) The documentor creates HTML, PDF, CHM, or XML formatted documentation for a source code file.
Automatic syntax analysis is another useful feature. Zend Studio automatically checks your input for syntax errors while you are typing. If it discovers an issue, it underlines the line of code in red, and it places a red stroke in the right-hand margin to mark the spot. You can then hover your mouse over the stroke, or the faulty code, and the IDE will show you the error message.
Zend Studio also provides code snippets - external code fragments provided by the open source community that have been tested for functionality. These code snippets are another very useful addition to Zend Studio 4 that can help you avoid re-inventing the wheel. The library has over 300 snippets and also supports an update function that allows you to import more snippets.
Of course, nobody can write code without making mistakes; it's just important to be able to find as many of your mistakes as you can. Again, Zend Studio gives you a wide range of options. The code analyzer is a neat feature. Although other IDEs have code analyzers, Zend's analyzer works in a unique way. The analyzer helps you find irregularities, which may or may not be errors. It analyzes your code and lets you know if it thinks it has found a mistake.
The code analyzer will pick up lines that may be syntactically correct but are poor programming style. You can call the code analyzer either by pressing the sequence [Ctrl]+[Alt]+[A] or by accessing the analyzer through the tools menu.
Of course, Zend Studio helps developers locate more hidden errors. The debugging tool allows you to interrupt code execution and check what is happening to critical variables. Zend Studio supports both local and remote debugging. Local debugging means running your code directly in Zend Studio with the output appearing on the right hand side of the Zend Studio window. As it is often impossible to test everything locally, Zend Studio also supports debugging on a server.
Just running the whole program code and checking the results is not a useful way of debugging. This is why Zend Studio allows you to set any number of breakpoints. You can add or remove a breakpoint simply by clicking the line number. After setting breakpoints, pressing [F5] or selecting Run in the debug menu will run the code. When the parser reaches a line with a breakpoint, it interrupts the program execution just before that line, allowing the developer to inspect the system status more closely.
As previously mentioned, the right-hand part of the screen displays the script output. You can inspect the current script status below this area. This panel shows you the current variables, including both the data type and current content. Objects or array contents are displayed in the same way. By default, you only get to see local variables (that is, variables visible in the current context.) However, you can click on the + sign next to GLOBALS to view superglobals, including their current content. The call stack also makes for interesting viewing; you need to click on Stack to display it. The call stack is where the parser manages function calls. This allows you to view the stack with the names of the functions the system has called at the current time. The function at the bottom of the stack will always be main(), that is, the body of the program. This view gives developers the advantage of being able to inspect the variables in functions lower down the stack, which may be overwritten by other calls.
After reaching a breakpoint, you can either step through the code line by line or run the program to the next breakpoint. The former approach is useful if you want to inspect the changes to individual values as the code progresses. Pressing [F11] in the debug menu tells the interpreter to parse the next line. Selecting Run tells the interpreter to run the code to the next breakpoint.
Remote debugging is a more advanced form of troubleshooting where the code runs directly on the server and the session is remotely controlled by Zend Studio. To support remote debugging, you need to install the Zend Studio Server, which is included with the IDE license. If you did not install the server component while installing Zend Studio, you can download the server from www.zend.com.
The server is not a stand-alone application but needs to be integrated with an existing Apache Web server. You can use either the Apache server included with the product, or an Apache server you have installed previously. In the latter case, the installation program will attempt to locate the paths to the configuration files, such as httpd.conf and php.ini, or prompt the user for the paths.
Additionally, the installation program needs to know which clients are allowed access to the server. The Zend Server should not be deployed on production Web servers, as the installation routine replaces the index file in the server's DocumentRoot directory. Now, after relaunching the server, whenever you call the server's homepage in your browser, you are automatically redirected to the Zend Studio Server page. The page gives you an overview of the configuration and allows you to modify the PHP configuration. The installation program creates backup copies of the modified files.
The really interesting features for controlling the Zend Server are part of Zend Studio. You can enable server-supported debugging in Preferences | Tools | Debug. After doing so, it makes sense to test the connection to the server by selecting Check debug server connection. After successfully completing the test, you can then use the Debug URL function, or press the [F8] shortcut key. Type the URL of the page you want to test in the window that then opens. Click on OK to launch the session; this opens the browser and allows you to remotely control the session.
Zend Studio retrieves the source code directly from the server, so there is no need to create a local copy. In contrast to local debugging, the remote debugger halts before the first line of code, removing the need to set a breakpoint. Apart from that, the functionality is just like a local debug session. Interestingly, output is shown in Zend Studio and in the browser.
In some cases, output is first stored in an output buffer and not sent to the browser. In that case, adding flush() to the source code will send the output buffer content to the browser.
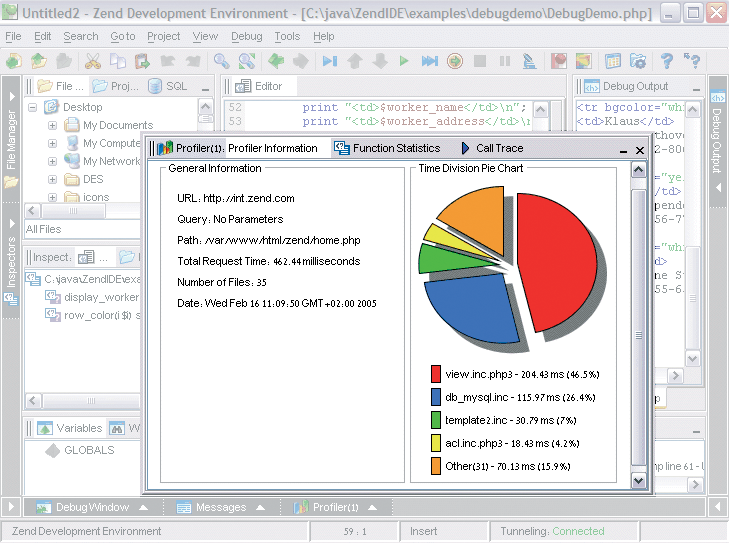
You may be familiar with the issue of slow response from new web applications. It is often difficult to locate the source of the bottleneck. Zend Studio gives you a profiler in the Tools menu. The profiler analyzes the program running on the debug server and displays the CPU time required to process a file or function (Figure 7.)
Although there are cheaper ways of programming in PHP, neither Eclipse, nor Emacs, nor Quanta+, give you a debugger. Zend's context-sensitive help is much more mature than the alternatives. Developers working on larger projects might miss support for Subversion, and the CVS client is still not perfect, but Zend Studio 4 comes with more than enough good features to compensate.
When all's said and done, Zend Studio is well worth the asking price.
| INFO |
|
[1] PHPDocumentor manual: http://www.phpdoc.org
[2] Zend: http://www.zend.com |