
By Kenneth Hess
Enter the mysterious, and much neglected, world of performance monitoring. The mystery and neglect have the same root cause; performance analysis is a very complex issue that can be quite daunting. Performance engineers typically deliver thick reports replete with statistical equations, graphics, and polysyllabic run-on sentences to explain why you will need to replace your current infrastructure within a given time frame. System administrators yawn at the lengthy explanations and statistics equations that, frankly, can look like recipes written in Martian. You may be wondering why you really need to worry about performance monitoring for Linux since hardware is at almost "throw-away" prices today. The answer is that, for larger installations of Linux and mission-critical applications, it is less expensive to add to your infrastructure than to replace it. With clustering, fail-over applications, and distributed environments supporting hundreds or thousands of users, adding another 4 CPU server with 4GB of RAM is infinitely more palatable to those who write the checks than replacing everything you have because you have run out of resources. By collecting performance data, you can make informed decisions about upgrading, adding to, or replacing hardware as business growth dictates.
The mystery, neglect, and boredom often evoked by performance analysis can be made far less severe with a tool called Orca. Orca gives you system performance reports in a graphical format in HTML pages. By default Orca presents graphical plots of several important performance parameters (see the box labeled "Orca Default Parameters").
Orca is quick and easy to set up - about 30 minutes, which includes reading the INSTALL file. The powerful Orca is generously provided for free by Dr. Blair Zajac. You'll find the Orca website at: http://www.orcaware.com. Blair describes Orca as "a tool useful for plotting arbitrary data from text files onto a directory on a Web server." Orca reads white space separated data files and watches the files for updates, creating plots of the data in the files. Orca can also plot the results of arbitrary Perl expressions, including mathematical expressions.
Orca then assembles the plots into an HTML tree of HTML or PNG formated graphs, creating an index of URL links listing all available targets. Orca can run under cron, or it can sleep by itself waiting for file updates.
| Orca Default Parameters |
|
By default, Orca monitors the following parameters:
|
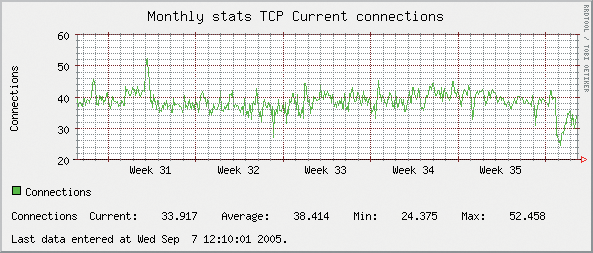
A default installation gives you hourly, daily, weekly, monthly, quarterly, and yearly summary data represented graphically and in tabular form. Its graphics provide you with summary information that is complete, yet visually simple enough to do a quick scan of many servers in a short amount of time. For each parameter that is measured, you get a graphic image containing the X and Y coordinates properly labeled with your data in tabular format showing current, average, minimum, and maximum values for the specified time (See Figure 1).
Orca utilizes RRDTool, a tool written by Tobias Oetiker, for logging and graphing. Orca is bundled with RRDTool and other required Perl modules in case you don't have them installed already. The requirements that need to be met prior to installation are very few. You need a working web server and Perl. During installation, the missing Perl modules will be installed for you into an Orca specific library directory so that it doesn't conflict with any existing package management systems (see the box titled "Orca and Perl"). The source trees for all the components are under the packages directory in case you would like to install them manually. The Procallator "package" is also installed with Orca. Procallator is the Linux-specific script that runs periodically to gather data from the /proc filesystem on Linux.
| Orca and Perl |
|
Requirements for Orca on Linux
|
Let's assume you have Perl and a web server already installed and working on your system. Dr. Zajac suggests you download the latest snapshot release [3]. Download, un-bzip2, and untar the file, then cd into the source directory that was created. I suggest that you read the INSTALL file before continuing with your actual installation, in case you need some special parameters for the configure script. At a minimum, you will need to know where you want your HTML files to go prior to using Orca. I chose my default web directory /var/www. Go ahead and create /var/www/procallator or Orca will complain that the directory does not exist when you run it for the first time. The html files and graphics will be created in this directory. Once you are prepared for the installation, issue the following commands:
./configure -with-html-dir=/var/www
make
make check (optional)
make install
There's already a Makefile target named procallator_run_at_boot_using_chkconfig to start Procallator at boot time on RedHat, CentOS, and chkconfig-based systems. Dr. Zajac is adding different makefile targets to start Procallator at boot time for Debian and Ubuntu systems. He is also working on startup scripts for Orca.
That is all there is to the basic installation, which places the executables in /usr/local/bin by default. At this point, you can issue the procallator command to begin data collection while you go into the configuration phase.
To begin collecting data, issue:
/etc/init.d/procallator start
Procallator will start in background mode and begin data collection using default locations and parameters.
The procallator.cfg file is in /usr/local/etc, assuming you used the default configure -prefix setting. procallator.cfg contains the file locations and variables that you can change to meet your specific needs. You can (and should) change the following items to customize your site.
Change the email address to one that will be regularly monitored in case something goes wrong:
warn_email root@localhost
If you want hourly plots, change the 0 to 1 and vice versa for any of the other time plots. I generally use the hourly plot for watching a system that may be in "trouble."
The following parameters specify which plots to generate:
generate_hourly_plot    0
generate_daily_plot     1
generate_weekly_plot    1
generate_monthly_plot   1
generate_quarterly_plot 1
generate_yearly_plot    1
The find_files parameter points to the base data directory for raw data. By default, this directory is /usr/local/var/orca/procallator. Under this directory, you will find your raw data directory. It is named the same as the hostname. The raw data files are named as proccol-YYYY-MM
-DD-00X. Each night, the last opened raw data file will be compressed as either procol-YYYY-MM
-DD-00X.gz or procol-YYY-MM-
DD-00X.bz2 to conserve disk space. If you want to modify the location of this directory, you will need to manually edit the /usr/local/bin/procallator script and change the $DEST_DIR setting and also edit the find_files value in procallator.cfg.
Once you have edited the procallator.cfg file to your satisfaction, you are now ready to use Orca. If you started the data collector (Procallator) at the end of installation, you should now have enough data to plot. (By default, Procallator measures the system on five minute intervals, so you may have to wait for the first measurement to be taken.) To give Orca a try, enter the following command:
orca -o /usr/local/etc/procallator.cfg
This command tells Orca to run once (-o) and refers it to the configuration file that we just edited. This first pass will create necessary directories and files in your /var/www/procallator directory. When Orca has finished processing the data, you will get the message "Orca has completed." You can now check out your performance data at:http://your-server/procallator/.
There will probably not be much to look at in terms of actual data, but all of the default plots and pages are now created and ready for you to inspect. Your index.html page should look something like the page shown in Figure 2.
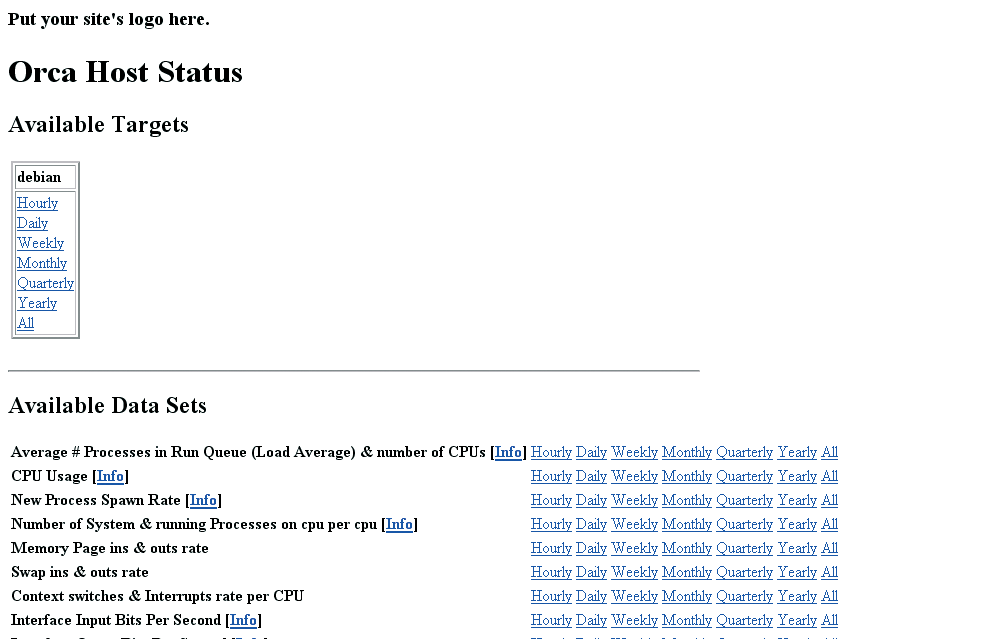
Notice that the title of the box is, or should be, your hostname. In the example case, the hostname is debian. If you click one of the links, you will be taken to the performance data pages for that timeline. The example graphic in Figure 3 shows the first of the hourly graphics for my host, debian.
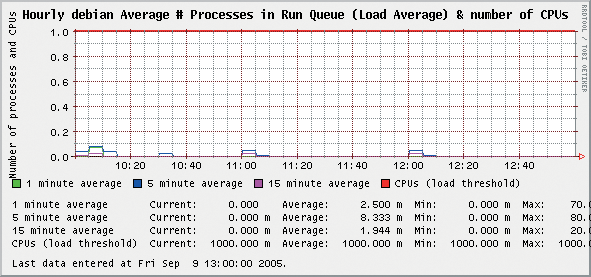
The graphics are self-labeling and include the name of the host to which they refer. This will come in handy when you are looking at multiple hosts in a short amount of time. To see a real-life example of Orca on multiple hosts, point your browser to: http://stats.xmission.com/linux/.
You should set up Orca to run hourly if you want the hourly plots to be updated that often. My cron entry is:
@hourly /usr/local/bin/orca -o/usr/local/lib/procallator.cfg
If you only want Orca to run daily (at midnight) use:
@daily /usr/local/bin/orca -o/usr/local/lib/procallator.cfg
Of course, you may use any time interval you wish. These are just examples.
Installing, configuring, and using Orca and Procallator is very simple. There isn't much to troubleshoot for Orca for a default install. If, however, you need to customize something, sometimes there can be issues with the number of columns in the RRD files compared to those that Orca is using.
Column data is a very common issue and is covered in the Orca FAQ [4]. There are a couple of issues that are not covered in the FAQ with which you may need assistance. The first is gaps in your data. You may experience, at some point, gaps in your data. The second is that you need to completely regenerate your data for any number of reasons. Both of these issues have the same resolution; remove the RRD files and reprocess your data. Look in your procallator.cfg file to find the location of rrd_dir. The default location is: /usr/local/var/orca/rrd/procallator/.
Under this directory is another directory called procallator_hostname, where the RRD files are kept. To regenerate the data, remove all of the RRD files. Then issue the following commands. These commands will regenerate the necessary RRD files without recreating the html and graphics:
/usr/local/bin/orca -o -no-html -no-images /usr/local/etc/procallator.cfg
Then process the RRD files normally, creating the html and graphics.
/usr/local/bin/orca -o /usr/local/etc/procallator.cfg
The reason for this two-step process is to spare system resources. If you process a great deal of data, creating the RRD files, html, and images may run your machine critically low on swap space. If there are gaps in your data and it was caused from the data collector being down, you will not be able to fill in the gaps.
By putting the data collector in your startup scripts, you will ensure that, even after a reboot, your data will not suffer wide gaps. There are some startup scripts provided for you in the source tree under the data_gatherers directory. It would also be wise to put in a process checker script to make sure the data collector does not go down and cause gaps in your data. If the process dies, have the script restart Procallator and email you an alert. If you choose to have Orca running continuously, that is, without the -o command line option, Orca will send out emails when it sees that a data file has not been updated in a few minutes.
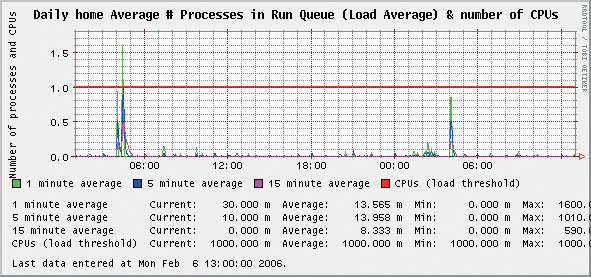
As a System administrator you should do regular performance checks on your systems. As stated earlier, Orca makes this easy. You can check a number of hosts at a glance then move on to other tasks. The parameters that I check regularly are CPU, Memory, Network, and Disk Usage. These are the most problematic areas for production systems. You first need to learn what a healthy system's graphics look like so that you can easily and readily recognize performance issues. When I check performance using Orca, I use the Weekly Performance Charts, noting any spikes or suspicious trends in performance. If I detect anything unusual, I then go to the daily charts. Figure 4 shows a system with CPU performance spikes. Since I am familiar with this system, I know these spikes are associated with my daily scheduled run of up2date.
I like to check the Daily graphs because they give me a very fine grained look at the last 24 hours worth of performance data. Hourly graphs will give you the finest grained look at your data, although I don't regularly check them unless the Daily graph gives me a reason to take a closer look.
In addition to these specific performance graphs, I check sar, mpstat, and iostat values to more clearly diagnose any problems detected in the Daily or Hourly Orca graphs. Quarterly and Yearly charts are very useful for visualizing performance trends. These graphs are most valuable for observing performance degradation over time, as well as for providing hard evidence that your network is in need of hardware additions, upgrades, or replacements. These charts are also extremely handy when printed out and taken into managerial meetings. One word of caution: make every effort to perform careful analyses and do some performance tuning before recommending upgrades or replacements.
Diligent performance monitoring means being vigilant and learning the quirks and personalities of all of the systems under your control. Orca is one way to maintain vigilance. My experience with Orca and Procallator comes from direct work with these tools in a very large enterprise environment where availability and performance directly affect the bottom line. For anyone who needs to check the performance of just a few systems, or up to hundreds, I strongly recommend Orca.
We have only had the opportunity to scratch the surface on the very broad topic of Linux performance monitoring. The subject would make an excellent topic for a book. (I hope my agent reads this.) Orca is an excellent tool for assessing current activity and watching trends in performance for your systems. In my opinion, it should be installed on your existing systems and all the new systems you acquire. The information it provides is invaluable to system administrators, architects, and management for making intelligent decisions in tuning, purchasing, and upgrading the computing infrastructure.
| INFO |
|
[1] Orcaware: http://www.orcaware.com/
[2] RRDTool: http://people.ee.ethz.ch/~oetiker/webtools/rrdtool/ [3] Orca Snapshots: http://www.orcaware.com/orca/pub/snapshots/ [4] Orca FAQ: http://www.orcaware.com/orca/docs/FAQ.html |
| THE AUTHOR |
|
Kenneth Hess is a freelance technical writer who writes on a variety of Open Source topics. He can be reached through his website at: http://www.kenhess.com. Special thanks to Orca creator Dr. Blair Zajac and Guilherme Chehab, creator of Procallator, for their assistance and for reviewing this article. |