
By Heike Jurzik
What exactly is your Linux system doing right now? Which programs and processes are running in the background? Which application is accessing the CD-ROM drive? And how can you terminate a process if it won't die gracefully? In this article, we'll explore some answers to these eternal questions.
The ps program outputs a list of active processes. Running ps without specifying any options gives a list of applications running in the current shell. If you need more information, you can specify some of the tool's impressive collection of options. As the manpage tells you, ps understands Unix parameters with a simple dash, BSD options without a dash, and GNU options with two dashes.
It is a matter of your own preferences which you choose, but in this article, we will be concentrating on the shorthand variants without dashes. To output a list of all your own processes, you would specify the x option (see Listing 1), for example.
| Listing 1: ps with the x option |
01 nonumber 02 $ ps x 03 PID TTY STAT TIME COMMAND 04 3705 ? Ss 0:00 /bin/sh /usr/bin/startkde 05 3763 ? Ss 0:00 /usr/bin/ssh-agent /usr/bin/startkde 06 3789 ? Ss 0:00 kdeinit Running... 07 3792 ? S 0:00 kdeinit: dcopserver --nosid 08 3794 ? S 0:00 kdeinit: klauncher 09 ... |
The ps command gives you a nicely sorted list of the processes running under your own user ID. The command sorts the output by Process Identifier, that is, the unique process number (PID), the number of the terminal or virtual console (TTY), the process status (STAT), the CPU cycles used (TIME), and command name including parameters (COMMAND).
In the STAT field, ps typically lists one of the following statuses:
If you are interested in viewing tasks belonging to other users on the system, you can specify the a option. Since this long task list does not give you the user IDs for the programs, you might also like to set the u flag to output the owner, CPU time, and memory usage (see Listing 2 for an example).
| Listing 2: Process information on other users |
01 nonumber 02 $ ps aux 03 USER PID %CPU %MEM VSZ RSS TTY STAT START TIME COMMAND 04 root 1 0.0 0.0 1504 512 ? S 08:31 0:00 init [2] 05 ... 06 huhnix 3705 0.0 0.2 2748 1296 ? Ss 08:33 0:00 /bin/sh /usr/bin/startkde 07 ... |
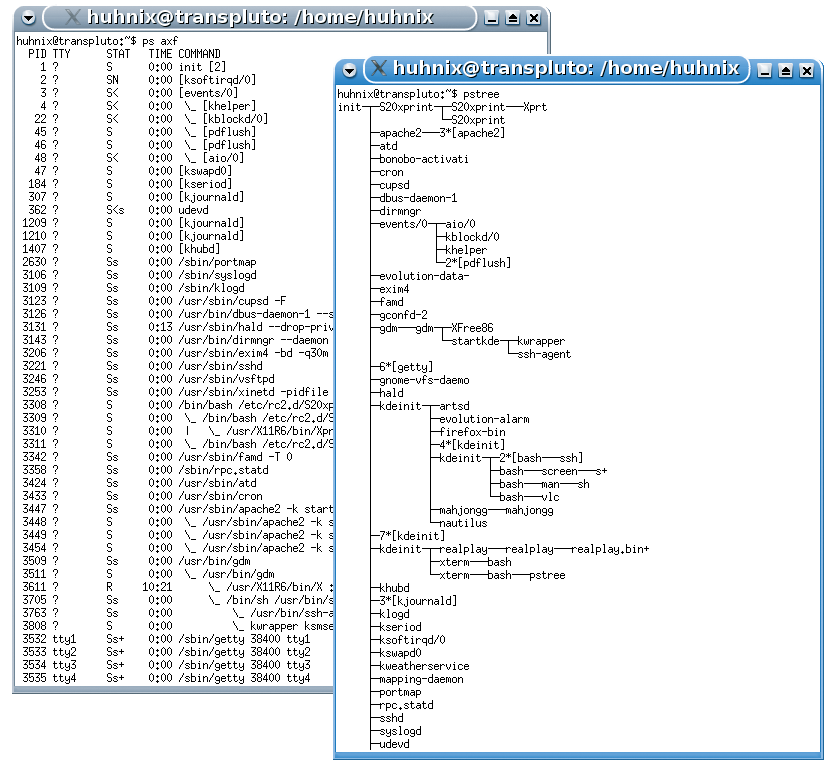
In some cases, processes spawn other processes; the first process to launch after booting is always called init. Starting at this parent process, other tasks are then launched, and these child processes are also allowed to spawn more processes. The l option shows you the relationships, telling ps to display another column with the Parent Process ID (PPID).
The f parameter makes the hierarchy even easier to read, using an ASCII image to do so. As an alternative to the f parameter, you might like to run the pstree program, which also gives you a useful overview of the relationships (Figure 1).
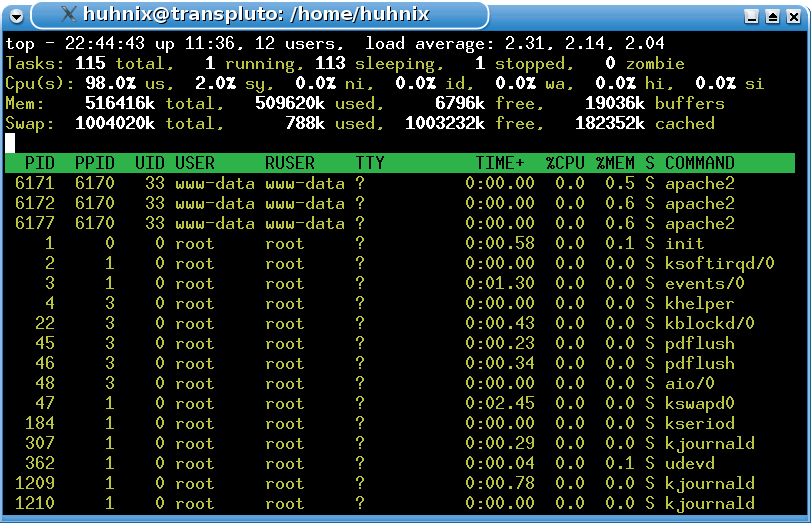
If you are looking for CPU hogs, ps is not your best option. As it simply gives you a snapshot of the current status, you will not find out too much about the current system load. But Linux has the top tool to help you with this task. Top is a process monitor that updates the display to give you the current status. You can launch the monitor by typing top at the command line.
The program gives you extensive information about your system and the processes running on it. The top line shows the time, the computer uptime, the number of processes, and the status details, along with the CPU, memory, and swap load. The top status line contains information on the individual processes.
The status line has columns for the process ID (PID), the memory usage as a percentage (%MEM), the parent process ID (PPID), the user ID (UID), the CPU time consumed in percent (%CPU), and the command name (COMMAND). But you can tell top what you want to see: just press [F], and press the relevant letters to specify the status line content.
A number of commands allow you to interactively control top; for example, you can press [H] to display the online help. [U] followed by a username gives you the processes for that user. [Shift]+[R] reverts the output, showing the most frugal processes instead of the CPU hogs. [Q] quits the tool and takes you back to the Shell.
Pressing [Shift]+[Z] allows you to add color. The [W] key toggles through a number of predefined color schemes, but you can also press the appropriate letters and figures to define your own color scheme (Figure 2).
The lsof program (list open files) gives you more information on individual processes. This tool helps you discover which processes are accessing which files. If you run lsof without specifying any parameters, the command gives you a complete list of files, which can be fairly lengthy. You might like to pipe the list to the less pager for improved readability: lsof | less.
To find out which user on the system is currently working with the Vim editor, you can pass the name of the Vim binary to the program when you call it (Listing 3).
| Listing 3: Who is using Vim? |
01 nonumber 02 $ lsof /usr/bin/vim 03 COMMAND PID USER FD TYPE DEVICE SIZE NODE NAME 04 vim 4065 huhnix txt REG 3,10 1411096 647400 /usr/bin/vim 05 vim 4609 ardbeg mem REG 3,10 1411096 647400 /usr/bin/vim |
Lsof is particularly useful if you are interested in finding out which process is currently blocking a device file. If the system refuses to dismount a CD-ROM drive, for example, you can use lsof to find out which process is accessing the device file (Listing 4).
| Listing 4: Checking on device files |
01 nonumber 02 $ lsof /dev/hdc 03 COMMAND PID USER FD TYPE DEVICE SIZE NODE NAME 04 kdeinit 4466 huhnix 12r BLK 22,0 2846 /dev/hdc |
And now you can add the ps command, to give you the process hiding behind PID 4466. To do so, use the aux parameter with the w option to give you wide output - you can specify this parameter multiple times (Listing 5).
| Listing 5: Getting wide output |
01 nonumber 02 $ ps auxwww | grep 4466 03 huhnix 4466 0.0 2.4 27972 12572 ? S 11:33 0:00 kdeinit: kio_audiocd 04 audiocd /tmp/ksocket-huhnix/klauncherz9ZRha.slave-socket /tmp/ksocket-huhnix/konquerorVPZ1va.slave-socket |
The culprit is obviously a Konqueror window showing the content of the CD. To free up the drive, you probably just need to close the file manager window, or simply change directory. If this does not help, you can always resort to the kill program to terminate really stubborn processes.
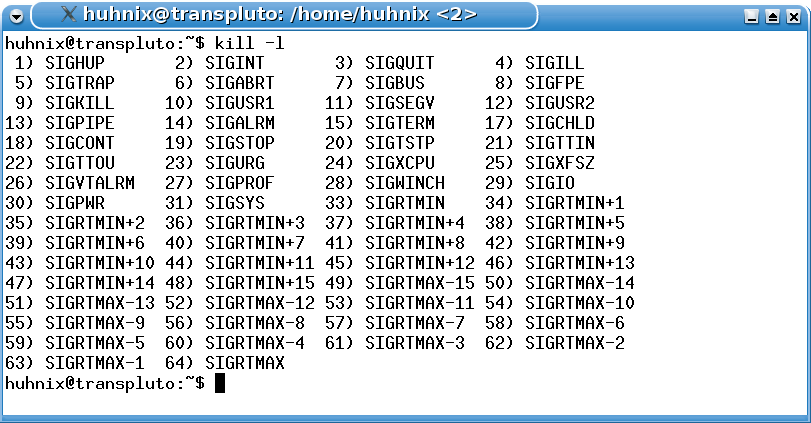
The kill program sends signals to a process, including a signal telling the process to reparse its configuration file (SIGHUP), to terminate gracefully and clean up (SIGTERM), or to terminate irrespectively of the consequences (SIGKILL).
Signals telling processes to take a time-out (SIGSTOP) and restart (SIGCONT) are also nice to have. kill -l gives you a complete list (Figure 3). Unless you are the system administrator, you can only send these signals to your own processes; root is allowed to run kill against global processes or other users' processes.
By default, the simple kill command sends signal 15 to the process. Another argument you can specify is the unique PID, as in kill 4200. If this doesn't help, and the process persists in the list, you may need to take more drastic steps and send the job off to the happy hunting grounds.
A numerical value lets you shoot the process down in flames (kill -9 4200); you can use the name (kill -KILL 4200) as an alternative - note that you need to leave out the SIG prefix with the latter option. If this option still doesn't put an end to the pesky process, all you can do is wait for a timeout. And in some (thankfully rare) cases, you may need to restart your computer to clean up.
The ability to halt specific tasks (kill -19 pid) is also useful. To continue the process, just send kill -18 pid to the process ID. To reparse a modified super daemon, Inetd or Xinetd configuration, send the server the hang up signal:
nonumber
kill -1 `cat /var/run/inetd.pid`
kill -1 `cat /var/run/xinetd.pid`
The killall program supports the same signals as its colleague kill, but instead of the ID, it expects the process name. If you run killall without specifying the signal, the program will assume that you mean -15 (-TERM). Thus, calling killall firefox-bin will gracefully terminate all instances of the Firefox browser.
As killall really does is take a roundhouse swipe at active processes, caution is advisable - the command killall bash will terminate all instances of Bash, including the shell where you typed the command. You can specify the -i option to switch to interactive mode; this lets you choose which processes to kill on an individual basis:
nonumber
$ killall -i xterm
kill xterm(3838)? (y/n) y
kill xterm(4242)? (y/n) n
kill xterm(4246)? (y/n) y
kill xterm(4250)? (y/n) y
The killer command outputs the PID and prompts you for each process that matches the name you specified. You can then decide to let the process live (by pressing [N]); if you press [Y] it's "Time to say goodbye."