
By Michael Schilli
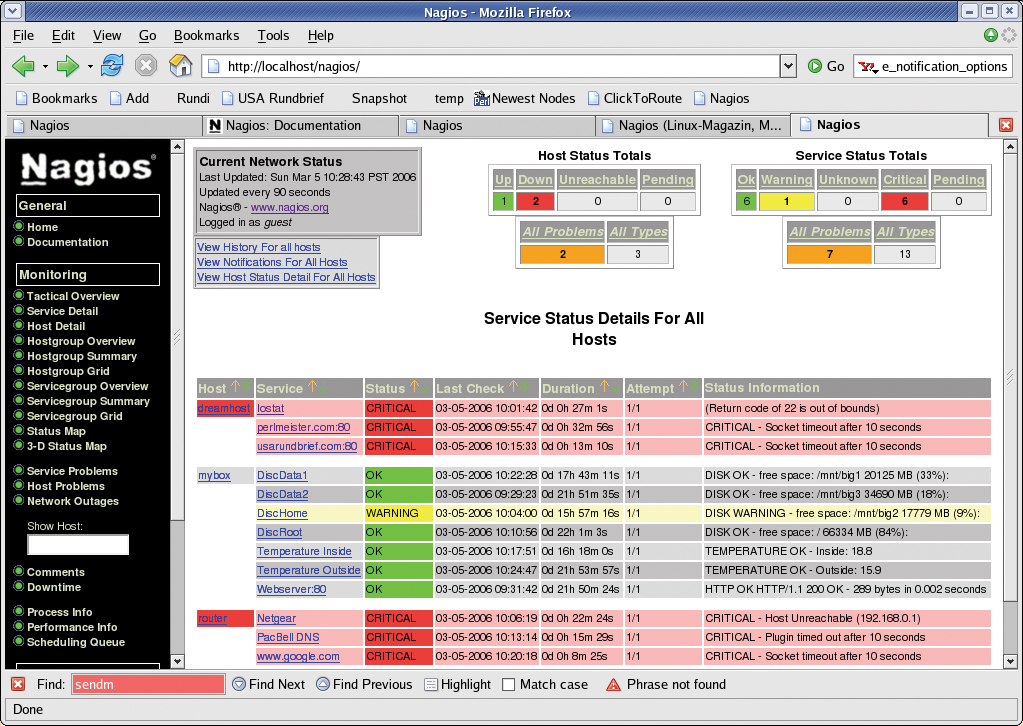
You may be familiar with the scene: you hear the sound of your decidedly non-technical partner in the next room shouting "My Internet isn't working!" Of course, painstakingly checking if the router really is talking to your service provider, and if the DNS server is reachable, would be one possible response. But troubleshooting is a lot easier if you have a software tool that keeps an eye on critical functions and gives you a friendly web-based summary like the one shown in Figure 1.
An open source tool called Nagios is perfect for this kind of monitoring. The developers have a long list of plugins at [2]. The plugins can help you monitor websites, databases, networks, and many other things. And if you have a special requirement not covered by the standard plugins, you can tailor a plugin to meet your needs.
Just to give you an example, Nagios can perform ongoing tests to check if a hosting provider is giving you a powerful server with enough resources, instead of overloading the server by hosting too many websites on it. If, for security reasons, the Nagios installation on the local machine does not have direct shell access to the provider-side host, you can simply install an agent on the website.
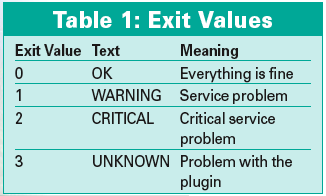
Dropping the iostat.cgi agent script (Listing 1) into the CGI directory on the web server you want to investigate will help here. Triggered by a HTTP request, the script calls the iostat Linux command and sends some of its output back to the client, which happens to be a Nagios plugin. The plugin then interprets the results and uses the exit code to tell the Nagios application if the values are OK, or if a problem has occurred (Table 1).
The CGI script, iostat.cgi, uses the tap function from the CPAN Sysadm::Install module to call the iostat command with the values 1 and 2 (Line 8). Due to the interval value of 1, and the count value of 2, it measures the CPU performance and hard disk I/O twice within a second and creates the output in Figure 3.
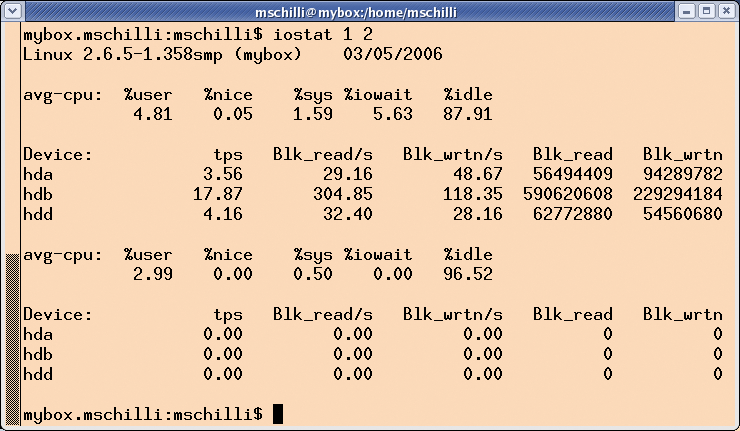
The first test gives you the mean values since the last reboot, while the second is more interesting for Nagios, since it aggregates performance over one second while the command is running. The %idle column tells you how long the CPU was available, and %iowait measures how long the CPU had to wait for the hard disk. From the customer's point of view, a high value for %idle and a low value for %iowait are most desirable.
The script iostat.cgi in Listing 1 reads the output from iostat and discards the first set of measured values. For this, it uses the regular expression $RE{num} {real} from the Regexp::Common repository to parse the numeric values. Following the obligatory HTTP header, it returns a string like user 2.99 nice 0.00 sys 0.00 iowait 0.00 idle 96.52. The so-called zero-width assertion, \G (Line 20), prevents the regex engine from jumping back to the start of the text each time and tells it to continue the search after the last match.
| Listing 1: iostat.cgi |
01 #!/usr/bin/perl -w
02 use strict;
03 use Sysadm::Install qw(:all);
04 use CGI qw(:all);
05 use Regexp::Common;
06
07 my ($stdout, $stderr, $rc) =
08   tap "iostat", 1, 2;
09
10 $stdout =~
11   /avg-cpu.*?avg-cpu/gs;
12
13 print header();
14
15 for my $key (
16  qw(user nice sys
17  iowait idle)
18   ) {
19  if ($stdout =~
20   /\G.*?($RE{num}{real})/gs) {
21   printf "%s %s ", $key, $1;
22  }
23 }
|
Nagios-side, the plugin in Listing 2 uses LWP::Simple to call the CGI script we just looked at on the server, picks up the output line, and runs split to split the output into fields which it then stores in the %values hash. If the CPU availability value is lower than 50 percent, the plugin reports a critical state; it just issues a warning for a value of less than 80 percent. The same principle applies to the iowait value, but the threshold values are 10 and 20 percent in this case.
The CPAN Nagios::Clientstatus module offloads some of the work off the plugin by checking if the plugin has been passed all the required parameters. The exitvalue() method also understands strings such as warning, rather than the numeric value of 1 from the world of Nagios. If you run the plugin at the command line by entering check_iostat -url=http://server/cgi/iostat.cgi, the plugin gives you the following lines of output:
IOSTAT OK - user 2.99 nice 0.00 sys 0.00
iowait 0.00 idle 96.52
Nagios will be calling the plugin just like this later, and it will interpret the exit value and later display the plugin's text output on stdout. Note that Nagios::Clientstatus requires version 2.35 or newer of Getopt::Long.
| Listing 2: check_iostat |
01 #!/usr/bin/perl
02 use strict;
03 use LWP::Simple;
04 use Log::Log4perl qw(:easy);
05 use Nagios::Clientstatus;
06
07 my $version = "0.01";
08 my $ncli    =
09   Nagios::Clientstatus->new(
10     help_subref => sub {
11       print "usage: $0 ",
12             "url\n";
13     },
14     version => $version,
15     mandatory_args =>
16                     ["url"],
17   );
18
19 my $url =
20   $ncli->get_given_arg(
21                      "url");
22
23 my $data = get $url;
24
25 if (! $data) {
26  print
27    "Failed to get $url\n";
28  exit $ncli->exitvalue(
29   "unknown");
30 }
31
32 my %values = split ' ',
33                    $data;
34
35 my $status =
36   $values{idle} < 50
37   ? "critical"
38   : $values{idle} < 70
39   ? "warning"
40   : $values{iowait} > 20
41   ? "critical"
42   : $values{iowait} > 10
43   ? "warning"
44   : "ok";
45
46 print "IOSTAT ", uc($status),
47   " - $data\n";
48
49 exit $ncli->exitvalue(
50                     $status);
|
To add the new plugin to an existing Nagios installation, the admin user needs to copy the check_iostat script to the /usr/local/nagios/libexec directory and make the script executable. Figure 4 adds a template titled ez-service to the Nagios configuration; this will make it easier to add more services later. In Nagios configurations, it is common practice to define templates, which are easily identifiable by their register 0 entries. Service definitions can be used later to add special entries to the templates.
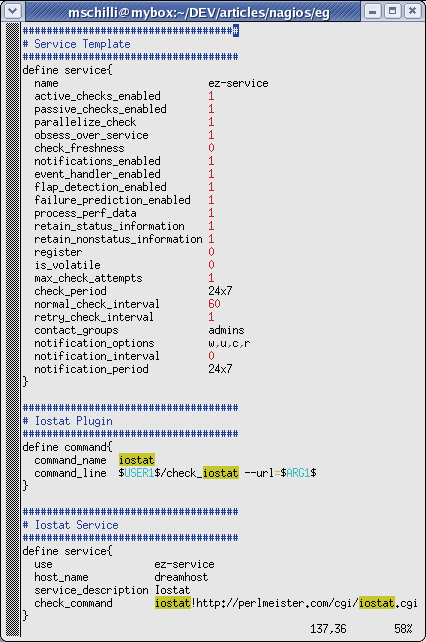
The define service configuration in Figure 4 defines the new Iostat service. It builds on the use ez-service template, which we defined earlier, and accepts various parameters for test runs, email notification, and many other things. These template settings are then inherited by the service definition and can be overridden as necessary.
Some settings and their meanings: the notification_interval 0 entry prevents Nagios from sending multiple mails to report a single issue. Admins can set the normal_check_interval to specify the interval between service tests in minutes, and max_check_attempts to specify how many tests you will allow to fail before Nagios should notify you. The service_notification_options specify the state changes that need to occur before Nagios sends a message. The w option refers to a warning, u stands for unknown, c for critical, and r for recovery. A similar principle applies to host_notification_options; besides unknown and recovery, it features the d for down option.
If the Nagios server is cut off from the rest of the world due to a network failure, you can't expect it to send you an email warning via the Internet. In this case, admins at least get a recovery mail as soon as the problem has been remedied. Nagios also supports event handlers to define actions that Nagios performs when it detects a problem. The system can solve some problems autonomously without admin intervention.
With Nagios 2.0, a service is always mapped to a host that is independently tested for availability. The host specification requires entries in the configuration file. The host_name dreamhost line in the sample configuration defines the host's name, by which it will be referred to later on the Nagios display page.
The service definition's check_command parameter specifies how to call the new check_iostat plugin. However, the call is not made directly in the service definition; instead it uses a command configured earlier by define command to specify the command line to run. The check_command line can take optional arguments, which it then passes on to the command definition. Separated by an exclamation mark, the URL on the check_command line gets passed on to the iostat command definition and replaces the $ARG1$ placeholder.
The value of 24x7 for the check_period and notification_period requires settings to define the admin's email address and availability. You can pick up a sample file titled eznagios.cfg at [1], and add a cfg_file=/usr/local/nagios/etc/eznagios.cfg line to the configuration file, nagios.cfg. At the same time, eznagios.cfg defines Nagios tests that tell you how much disk space is occupied and if your service provider's router and DNS server are working.
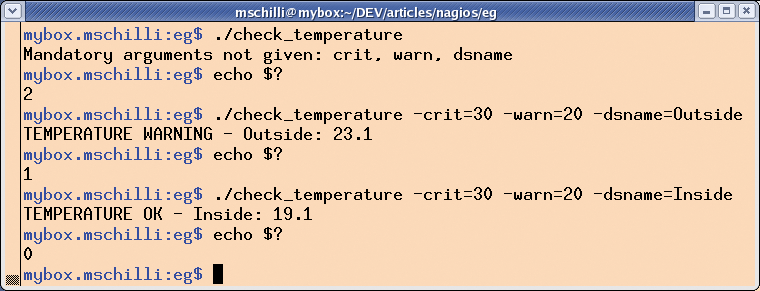
check_temperature is another neat example of a home grown Nagios plugin. The script (Listing 3) contacts the round-robin database for the temperature gage introduced in [3], and alerts you if most recent external or internal temperature exceeds specific thresholds. In typical Nagios plugin style, it accepts command line parameters for threshold values. Calling check_temperature -warn=30 -crit=35 -dsname=Inside triggers a warning if the internal temperature climbs above 30 degrees Celsius. The critical threshold is 35 degrees. Figure 5 shows the various exit values and plugin output for different parameter settings.
In a similar style to the Iostat plugin we looked at earlier, the service entry check_command check_temperature!25!30!Inside passes the parameters 25, 30, and "Inside" to the script. The corresponding command entry looks like this:
define command {
command_name check_temperature
command_line $USER1$/check_temperature -warn=$ARG1$ -crit=$ARG2$ -dsname=$ARG3$
}
The central section of the colorful table in Figure 1 shows that both temperature values are quite normal: 18.8 degrees Celsius (internal) and 15.9 (external). At least my apartment's not burning!
| Listing 3: check_temperature |
01 #!/usr/bin/perl -w
02 use strict;
03 use RRDTool::OO;
04 use Getopt::Std;
05 use Pod::Usage;
06 use Nagios::Clientstatus;
07
08 my $N = "TEMPERATURE";
09
10 my $nc =
11 Nagios::Clientstatus->new(
12  help_subref =>
13    sub { pod2usage() },
14  mandatory_args => [
15   qw( crit warn dsname)
16  ],
17 );
18
19 my $rrd =
20   RRDTool::OO->new(file =>
21    "/tmp/temperature.rrd");
22
23 my $dsnames =
24   $rrd->meta_data("dsnames");
25
26 $rrd->fetch_start(
27  start => time() - 6 * 60,
28  end   => time()
29 );
30
31 my $temp;
32
33 if (my ($time, @values) =
34  $rrd->fetch_next())
35 {
36  for (
37   my $i = 0 ;
38   $i < @$dsnames ;
39   $i++
40    )
41  {
42   if (
43    $dsnames->[$i] eq
44    $nc->get_given_arg(
45     "dsname")
46     )
47   {
48    $temp = $values[$i];
49    last;
50   }
51  }
52 }
53
54 my $status = "ok";
55
56 if (!defined $temp) {
57  $status = "unknown";
58 } elsif ($temp >=
59  $nc->get_given_arg("crit"))
60 {
61  $status = "critical";
62 } elsif ($temp >=
63  $nc->get_given_arg("warn"))
64 {
65  $status = "warning";
66 }
67
68 printf "$N %s - %s: %s\n",
69   uc($status),
70   $nc->get_given_arg(
71  "dsname"),
72   defined $temp
73   ? sprintf("%.1f", $temp)
74   : "NODATA";
75
76 exit $nc->exitvalue($status);
|
A tarball of the Nagios 2.0 distribution is available on the project homepage [4]. After unpacking, follow the steps in the "Installing Nagios" box for a working Nagios server. Another tarball [2] contains the standard plugins for Nagios-2.0; unpack the tarball in /usr/local/nagios/libexec.
The biggest obstacle to running Nagios is the configuration. After installing the tool, admins are expected to create no less than six (!) different configuration files. Fortunately, the distribution gives you a collection of sample files that you can edit. To do this, just rename the .cfg-sample files below /usr/local/nagios/etc to .cfg.
A Nagios installation should never be publicly accessible via the Internet. You might like to use the settings in Figure 6 when setting up your Nagios web server. After launching the Nagios daemon by entering /etc/rc.d/init.d/nagios restart (as root), and sending a HUP signal to the web server, authenticated users can then access the measured data and a series of report formats at http://localhost/nagios (Figure 1).
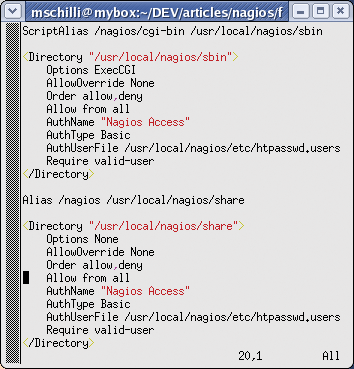
If the Nagios page resides behind a firewall, and if you are sure that it is accessible to trusted users only, you can leave out authentication and comment out the Require valid-user lines. In the Nagios configuration file, cgi.cfg, the entries in Listing 4 would grant a non-authenticated guest access to the full set of data and service commands.
| Listing 4: Guest Access |
01 # cgi.cfg: 02 default_user_name=guest 03 04 authorized_for_system_information=nagiosadmin,guest 05 authorized_for_configuration_information=nagiosadmin,guest 06 authorized_for_all_services=nagiosadmin,guest 07 authorized_for_all_hosts=nagiosadmin,guest 08 authorized_for_all_service_commands=nagiosadmin,guest 09 authorized_for_all_host_commands=nagiosadmin,guest |
| Installing Nagios |
|
Create a user and a group for Nagios: adduser nagios cd nagios-2.0 ./configure make all Install the binary executables, CGI scripts, and HTML pages, create the start script in /etc/rc.d/init.d, and then create a sample configuration: make install make install-init make install-config |
After making all these changes to the configuration files, it might be a good idea to check if the configuration is error-free before attempting to restart the daemon. To check the syntax:
cd /usr/local/nagios
bin/nagios -v etc/nagios.cfg
A well thought out monitoring strategy, performed reliably by Nagios, guarantees admins a good night's sleep - unless an alert is triggered, of course. But being awakened by Nagios ringing your pager is definitely preferable to being thrown out of bed when an irate user calls in the middle of the night.
| INFO |
|
[1] Listings for this article: http://www.linux-magazine.com/Magazine/Downloads/67/Perl
[2] Standard plugins for Nagios-2.0: http://prdownloads.sourceforge.net/nagiosplug/nagios-plugins-1.4.2.tar.gz [3] Michael Schilli, "How Cool is Perl?", Linux Magazine April, 2006, pg. 58 [4] Nagios: http://www.nagios.org |
| THE AUTHOR |
|
Michael Schilli works as a Software Developer at Yahoo!, Sunnyvale, California. He wrote "Perl Power" for Addison-Wesley and can be contacted at mschilli@perlmeister.com. His homepage is at http://perlmeister.com. |