By Juan Rafael Fernández García and Carsten Schnober
Dr. Geo lets you create geometric drawings interactively. This easy and effective tool, which has won numerous awards for educational software, lets you construct simple figures and even provides a programming interface for building more complex geometric shapes. The project is produced under the auspices of the Organization for Free Software in Education and Teaching (OFSET), and the author is Hilaire Fernandes. In 2000, the French association of Linux users (AFUL) voted Dr. Geo the best didactic application, and the Italian educational institution INDIRE handed a "Qualità Didattica" award to OFSET for Dr. Geo in 2005.
| Dr. Geo from the Teaching Point-of-View |
|
In 2004 Hervé Jeannot and Damien Joyant investigated the usefulness of Dr. Geo in teaching geometry to sixth grade pupils as part of their thesis at the IUMF Vesoul Teacher Training College. They applauded the fact that the tool compensates for a pupil's lack of artistic skills, allowing the teacher to concentrate on the basic theory: "Thanks to this software, we can concentrate on our pupils' mathematical abilities, rather than on their drawing skills. If you set a geometry test [on paper], the quality of the drawing is just as much a part of the result as the underlying mathematical theory. Dr. Geo allows us to judge a pupil's understanding of mathematics." |
Dr. Geo is included with most distributions, so you can typically use your preferred package manager to install. Source code and packages for the current version 1.1.0 is available for Suse 10.0, Mandriva 10.0 through 10.2, Fedora, and Debian-based distributions. You'll also find the source code at the Dr. Geo website [1].
After you install Dr. Geo, give the drgeo command to launch the program. The Dr. Geo main window is shown in Figure 1. Use the seven buttons in the construction toolbar just above the drawing area to create new diagrams. The first six of these buttons expand to show palettes that give you access to various functions.
The Point palette on the left lets you locate points on the drawing. In the drop-down menu, select the icon at the top for a simple point. After selecting the point tool, just click to insert points anywhere in the drawing area. To distinguish between points in more complex drawings, you can assign names to points. Selecting Other in the toolbox lets you change an object's style. If you click the Change an object's style tool, and then click a point, a dialog appears. You can then select the object's color, size, and appearance, and assign a name to the object.
Two points can be joined by segments and lines. The segment and line tools are both available in the palette below the Create curve button, which is available in the toolbar as well as in the taskbar on the left of the drawing area. After selecting the tool, click on two points to create a segment or line between them.
Drawing a polygon is similar. Start by selecting the polygon tool, which is also located in the Create curve menu. Then click on as many points as you like, before clicking the first point again, and the program joins up the points to create a polygon.
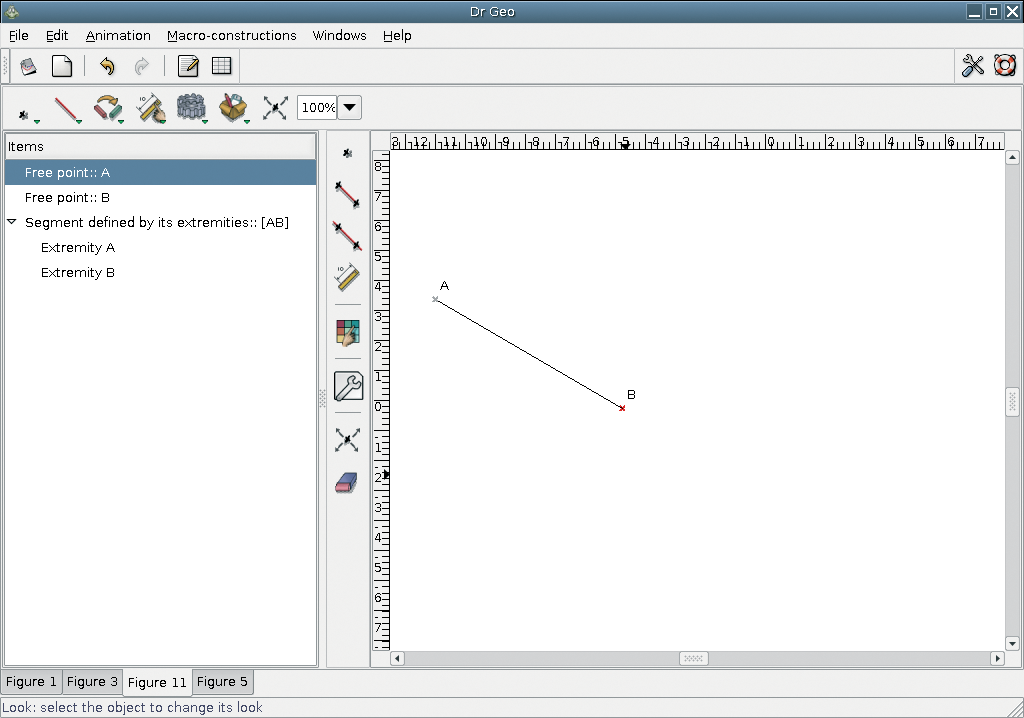
The item overview (on the left side in Figure 2) gives you an overview of the objects in the current drawing. The list is hidden between the edge of the drawing area and the vertical toolbox when you launch the program. You can click the edge of the toolbar and drag the bar to expand the list, revealing the points and other elements in your drawing.
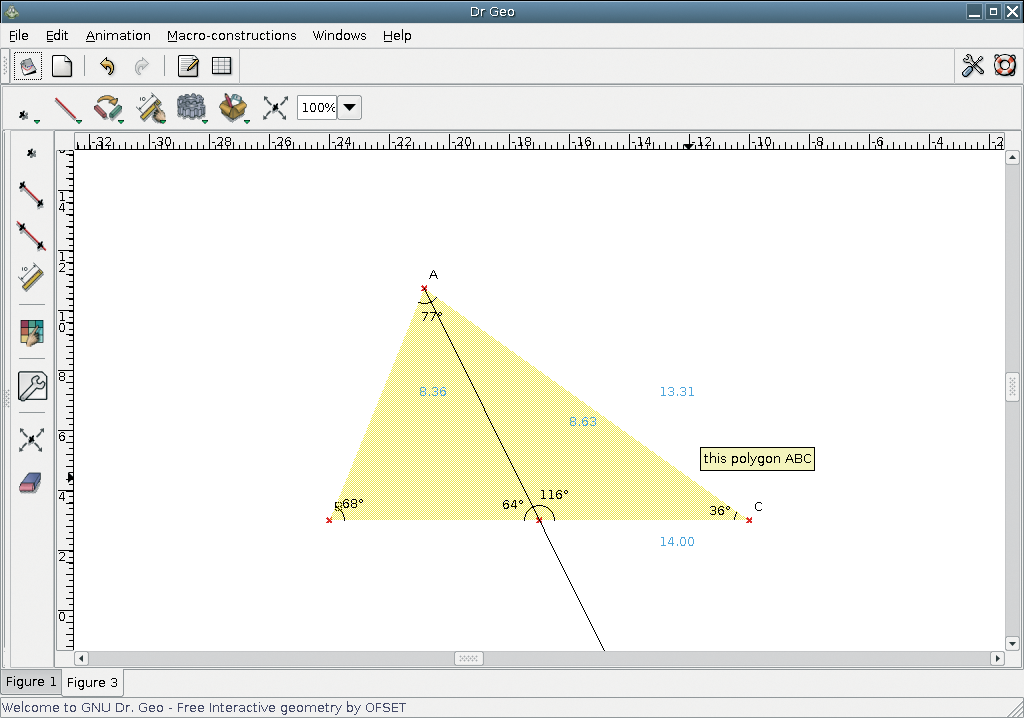
The Create numeric object palette gives you numerical information for your drawing. If you select the coordinate tool, and click three points, the tool gives you the angles between the points (see Figure 1). Alternatively, you can use the Curve palette to create two vectors and click them with the coordinate tool.
The Point palette has a function that inserts a point in the middle of a segment or between two freestanding points. If you then use the Move tool - the icon on the right in the horizontal toolbar - to move one of the reference points, the mid-point will automatically move to the right position.
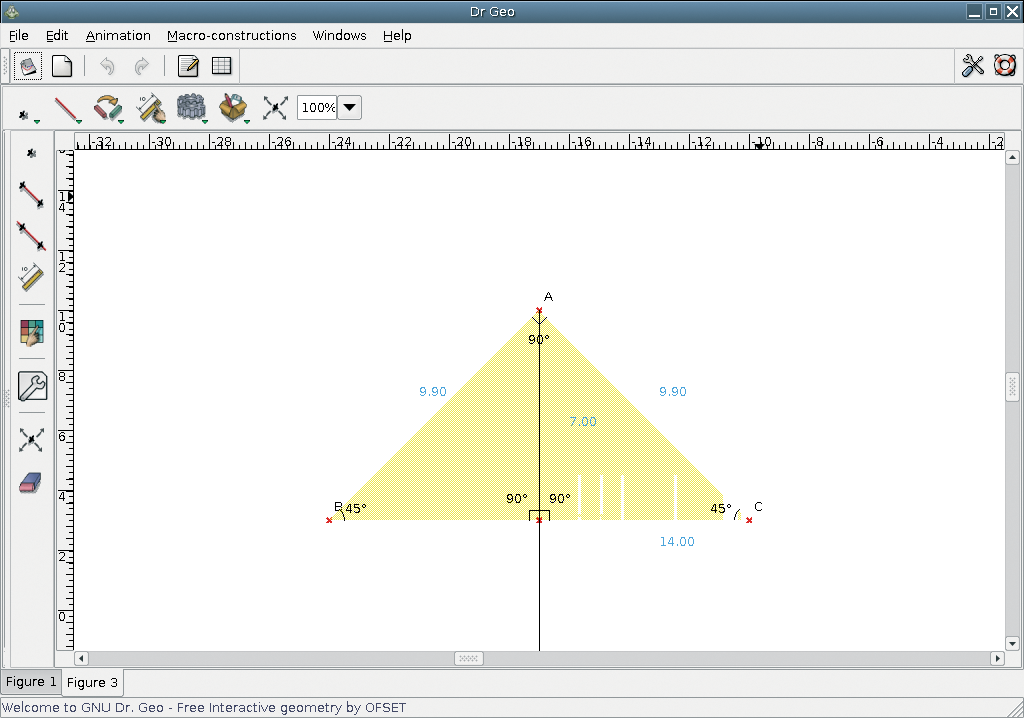
Measured angles react in the same way: if you move a reference point, changing the angle between the straight lines, the numeric values are automatically adjusted. This allows you to demonstrate, for example, that the sum of the angles in a triangle is always 180 degrees (Figure 3).
After exploring Dr. Geo's basic drawing functions, you can save your drawing by selecting File | Save. If you are working on multiple drawings, the File | Save multiple entry takes you to a dialog where you can select the entries you wish to save. To open a saved drawing, just pass the name to the program at the command line: drgeo -f figur.fgeo
Dr. Geo saves drawings as XML files (Listing 1), letting you edit the files with your favorite editor. File | Export... lets you create drawing files in other formats: vector graphics in standard Postscript, pixel-based PNG files, and LaTeX or Flydraw source code.
| Listing 1: A Dr. Geo data file |
01 <drgenius> 02 <drgeo name="Figure 8" scale="30.000000" origin_x="0.000000" origin_y="1.600000" grid="False"> 03 <point id="1C6DDB0" type="Free" color="Blue" thickness="Thick" style="RectangularEmpty" filled="False" masked="False" name="vue 3D"> 04 <x>0.466667</x> 05 <y>-1.266667</y> 06 </point> |
Using macros, Dr. Geo can repeatedly perform construction steps in various diagrams. A macro accepts input parameters based on mouse clicks by the user and uses them to create new objects.
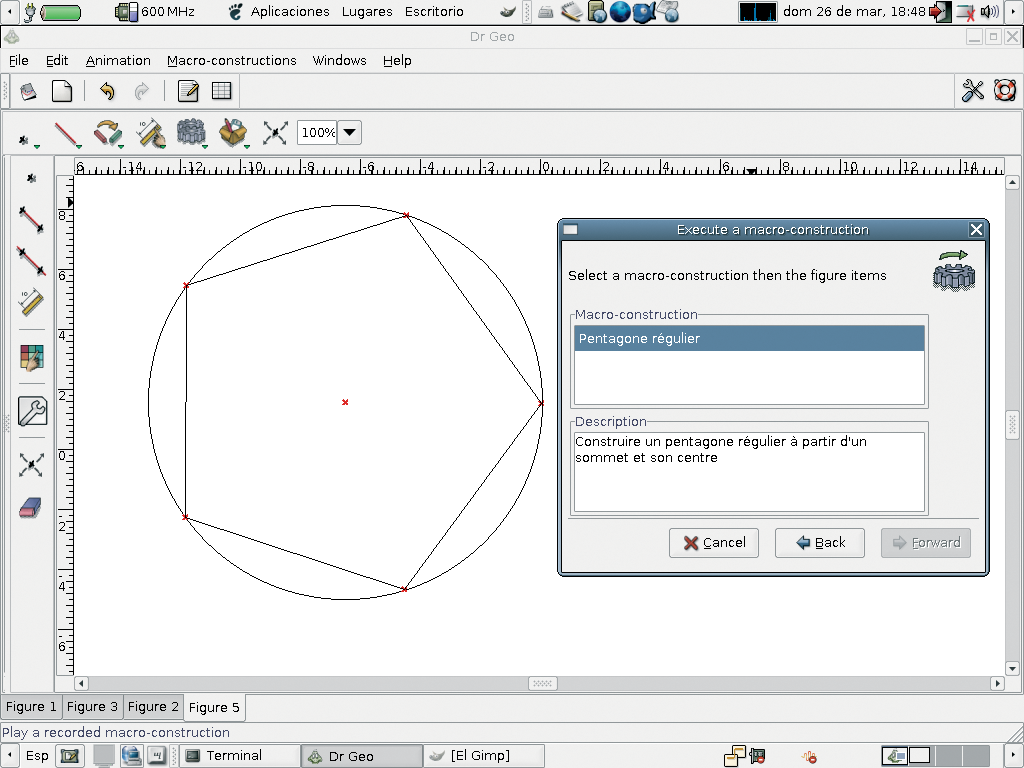
Dr. Geo comes with a collection of sample macros in the examples/macros directory: to enable a macro, choose File | Open and select the macro. This adds a new entry to the Macro-constructions menu, and selecting the entry runs the matching macro. For example, if you open the pentagone.mgeo file, you can use the Pentagone régulier macro - most examples are French and have not been translated thus far.
Hovering the mouse over a macro entry gives you a tool tip with details of the macro. If your French is up to the challenge, the pentagon example will explain that the macro expects two points as input parameters. It uses the first as the corner point, and the second as the mid-point of the pentagon. Start by drawing two points anywhere in the drawing area, then click the menu entry to run the macro and click on the two points. Figure 4 shows you the results.
But we had promised to create a macro ourselves. Just to demonstrate this, let's create a vertical line that intersects the mid-point of an arbitrary segment between two points defined by the user.
Start by drawing the desired result. Draw two arbitrary points A and B. Then use the segment tool to join the points. Then add the mid-point C. The Midpoint tool is located in the Point palette.
Now let's add a line at right angles to segment AB intersecting at point C. The Tools based on properties and transformations palette gives us the right tool for this job, second from top. Select the tool and first click on point point C, then on segment AB. As point C lies on the segment, hold down the mouse button; a drop-down menu appears, and you can select the required element - point or segment.
Now click the top icon in the Macro palette, Construct a macro. This opens a dialog that guides you through the required steps. Select Forward to go to the input parameter selection dialog. All our sample macro needs is a segment. Click on the segment in your drawing to tell Dr. Geo to add it to the dialog. Then press Forward again to continue, and in the next dialog, click the vertical line you constructed to define it as an output parameter.
Finally, enter a name and a description for the macro. Click Apply to add the new macro to your Macro-construction menu. To test the macro, draw a new segment and click on the new menu entry. Then select the segment with the mouse, and Dr. Geo will draw a vertical line through the mid-point. The vertical line moves dynamically when you change the reference points for the segment.
The only way to save a macro is to select File | Save multiple... In the dialog that appears, select the new macro; then press Save selection, and enter the target directory and a filename.
You can use Scheme programs to create more complex shapes. Scheme is a dialect of the Lisp programing language that is used in many applications, such as Geda (electrical circuits), Lilypond (scores), and GNUCash (home banking). Guile (GNU's Ubiquitous Intelligent Language for Extension) gives you an interpreter for the Scheme language, so you will need the Guile package installed on your system if you intend to add scripting abilities to Dr. Geo.
Dr. Geo gives you a collection of sample scripts in the examples/scheme directory below the installation directory. To view a script, open the script by selecting File | Evaluate, or press the keyboard shortcut [Ctrl]+[E]. Opening these files in a text editor shows you how the programing language works. To create a new diagram called Test, and to add a point at coordinates (1,2;-2), the following lines are all you need:
(new-figure "Test")
(let Point "A" free 1.2 -2)
The programing language has been translated into French and Spanish. This explains why some of the examples are not stored under free but under the libre keyword.
Scheme programing for more complex shapes does take some skill, despite the intuitive look and feel of the programing language. The Texmacs editor has a Dr. Geo plugin that can help you coding programs. In Texmacs, select the Insert | Session | Dr. Geo menu item to launch the Dr. Geo plugin.
| Squeak Support |
|
There are plans to support the Squeak programing language in future versions of Dr. Geo. Squeak, which is based on Smalltalk, is useful for introducing pupils to programing. A video at [2] demonstrates how to use Dr. Geo with Squeak. |
Dr. Geo has a big following, especially in France. Many users have contributed examples to the website at [3] demonstrating various basic geometrical principles. The extremely detailed manual has made Dr. Geo popular in other countries. And even if a manual is not available in your native language, the intuitive GUI lets you use the program without a great deal of training.
| INFO |
|
[1] Dr. Geo: http://www.ofset.org/drgeo
[2] Dr. Geo with Squeak: http://documentation.ofset.org/drgeo/videos/drgeo-squeak.avi [3] Dr. Geo gallery: http://community.ofset.org/wiki/Dr_Geo_gallery |
| THE AUTHOR |
|
Juan Rafael Fernández García is a secondary school teacher from Spain who has been a regular contributor of documentation and translations for free software for many years. He was a coordinator at one of the centers handling the integration of information and communication technologies in education in the Spanish province of Andalusia, and he works in the field of teacher training. He is also a member of OFSET. |