
By Ralf Spenneberg
Many administrators aren't concerned about the traffic on their networks as long as everything is working. The problem with this approach is that if you don't think about network analysis options until it is too late, the analysis often fails due to a lack of baseline data. Which connections are normal? How do you define unusually high traffic levels? You won't be able to answer these questions unless you have reference data that describes the normal status of the network.
Detailed studies of network traffic are not only of interest for troubleshooting: they can also help you locate incorrectly configured computers, detect worm or virus outbreaks, and perform forensic analysis. It is important to have reference data for all of your network connections, but simply logging raw network data often requires too much space. In most cases, it will be more than enough to record network traffic flows. A tool like Argus can help you collect and analyze network traffic.
A network traffic flow is an IP data stream - any TCP connection is flow, for example. Most monitoring systems log the IP address, the protocol, the ports, and the volume of data exchanged.
The pioneer of this technology is network device vendor Cisco, which added this kind of functionality to its devices many years ago. Cisco routers use UDP to export the network flows (Netflows) they have monitored, and there are many software products available, such as ntop [1], that can import and analyze this data.
Other router vendors have added compatible functions to their devices. Additionally, a number of Netflow probe programs run on Linux-based routers if you do not happen to have Cisco routers. The programs generate Cisco-compatible netflow data that administrators can process using ntop and similar products.
Ntop supports more detailed analysis than MRTG, for example, which does not analyze individual flows, but simply uses SNMP to display the total data throughput. If you just need to be able to identify trends, MRTG may be fine, but to evaluate the logged data, you need a tool that is able to display and analyze your data.
Argus [2] provides an alternative to Netflow and other monitoring tools. It consists of two components: a daemon that detects flows and logs them to a file, and a collection of clients that help the administrator analyze the flows. The format Argus uses may not be compatible to Cisco Netflow, but it does have more in the line of functions.
Whereas Netflow logs two flows for each connection (one for each direction), Argus collates this information to form a single flow. Unfortunately, the Argus format has changed over the years. The Canine [3] converter is available for older versions (Argus 2.0.5). Canine supports various formats, but unfortunately, not the format used by Argus version 3.0, the current developer version, which I will be investigating in this article. However, you can look forward to a new version of Canine soon after the final version of Argus 3 is released.
Before you can use Argus, you must install the Argus daemon on the systems with netflows you will be monitoring and logging. To set up the Argus 3.0.0 release candidate, first download the package, then unpack and follow the normal ./configure, make, make install steps to install. Then copy the configuration file to /etc and modify the permissions:
# cp ./support/Config/argus.conf /etc/argus.conf
# chmod 600 /etc/argus.conf
The modifications to the configuration file are self-explanatory. For the time being, we can just set the variable ARGUS_OUTPUT_FILE appropriately, and remove the pound signs. Argus clients retrieve data over the wire directly from the daemon when the daemon has enabled the port. The default port (561) is enabled by default.
For security reasons, you will probably want to set up a user account for the daemon after completing your initial tests, and set the ARGUS_SETUSER_ID option in the configuration file. The source code package includes a startup script, ./support/Startup/argus, for the daemon; Red Hat and Fedora Core users can copy the script to /etc/init.d/, and enable; other distributions, however, are not supported.
Regular rotation is a proven cure for oversized logfiles. In test environments, you can expect 2 to 5 MB of data a day, whereas productive networks will produce up to 100 MB of log input on a daily basis.
To support rotation, the source code archive has a argusarchive script under./support/Archive.
A cron entry to match would look something like the following:
0 1 * * * /usr/local/bin/argusarchive >> /var/log/argus/archive.log 2>&1
Before launching this for the first time, you will need to modify a few variables in the first couple of lines of the script - the archive directory, and the protocol file location, for example. (The current version of the script is still a bit buggy, so it makes more sense to use logrotate or a similar tool.)
Argus has a collection of data analysis tools. All of the commands start with ra (see Table 1).

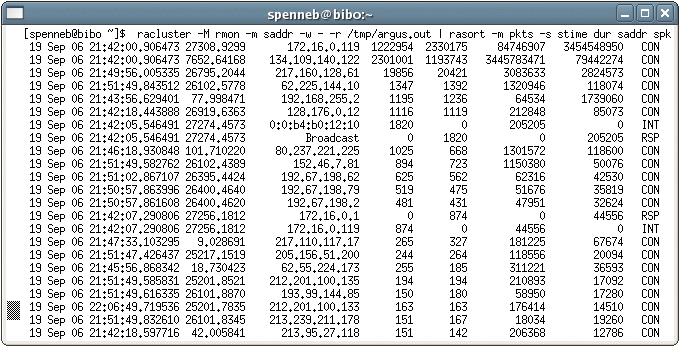
The most important tool has to be racluster. If you are interested in the top talker on your network, you are able to pass the -m saddr (source IP address) parameter to the command to tell it to combine all flows with identical addresses (Figure 1). The parameters shown in Table 2 store the Netflows; each of them is selectable for aggregation with racluster.

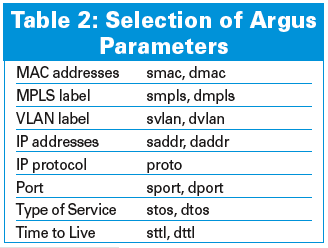
The -L0 option tells Argus to output a header with the column names. The -c parameter adds a separator (for example, -c \|). The columns in Figure 1 contain the following data:
Administrators can use the -s option to modify the display: for example, racluster -s stime dur saddr spkts will just display the time, duration, source IP address, and the number of packets sent.
Entering -M rmon, as shown in Figure 1 is a useful trick. Normally, a network node will be both client and server. Thus, Argus will see the node as a source in some flows and as a target in other flows. This option tells the tools to recalculate all flows. This function is also required for preparing data for RMON applications. Remote monitoring (RFC 1757) is another alternative for monitoring the network.
The racluster command sorts its output by the specified aggregation object (in our example, this is saddr). If you do not want to sort by IP address, but by the number of bytes sent, you can also specify the rasort command. racluster has a special -w - option for pipe operations (this tells the tool to send its output to standard output). Figure 2 shows how the sorted view gives administrators a useful overview of the traffic volumes on the network and of the systems behind the noise.
A question network administrators often ask is: "Which services do the users on my network really use, and what volumes of data do they exchange?" Enterprise policies might outlaw some services, and an analysis can help you to introduce appropriate countermeasures at an early stage. Trojans often use unusual ports that stick out in the list. Again, we need racluster to generate a list of the ports in use:
racluster -M rmon -m proto sport -r /tmp/argus.out -w - - ip | rasort -m bytes proto sport -s stime dur proto sport spkts dpkts sbytes dbytes
In this example, the source port (sport) is the aggregation object. When aggregating ports, it is important to specify both the -m sport and the proto; in fact, these details are mandatory.
All of the commands support tcpdump-style filtering, however, the Argus filters differ in a number of respects. The ra(1) manpage has more details. Every command will accept a minus character (-) followed by a Berkeley packet filter, which is ip in the last example. Filters of this kind allow administrators to restrict the analysis to a specific host or network, if needed (for example, ip and host 217.160.128.61).
A change in protocol distribution can indicate a trojan at work on your network. To detect this, you first need reference data for the normal distribution. Again, administrators can easily compile this data using Argus. The "Protocol Distribution on the Network" box gives you an example. The -s option again restricts the output to the columns you need.
| Protocol Distribution on the Network |
01 $ racluster -m proto -r /tmp/argus.out -s proto trans pkts bytes 02 udp 926 2478 330500 03 tcp 1190 3550430 3538952906 04 igmp 1 10 540 05 icmp 147 272 25936 06 llc 1365 1365 155155 07 ipx/sp 455 455 50050 08 arp 733 874 44556 |
For complex aggregations, racluster also supports the definition of flow models in a configuration file (racluster(5)). Besides a number of variables that control the behavior of racluster, this file contains filter definitions and optional model definitions. A filter specifies the flows racluster should analyze, and a model describes how aggregation is to be performed. Both of these details conform with Berkeley packet filters and the -m command-line option. A typical configuration file might look like this:
filter="src net ( 10.0.0.0 mask 255.0.0.0 )" model="saddr/8 proto dport"
filter="dst net ( 10.0.0.0 mask 255.0.0.0 )" model="daddr/8 proto dport"
In our example, Argus will first aggregate the flows that originate within the 10.0.0.0/8 network by source address, protocol, and target port. The tool with aggregate flows where the network is the target by target address and target port.
Setting Argus up for log rotation restricts the potential evaluation period. However, all Argus commands support the -t Timerange option, followed by the period to be evaluated. rasplit extracts the required data and stores it in a separate file; you can still use all the other filters.
If you prefer not to mess with the logfiles and use current data instead, it's no problem - tell the Argus daemon to publish its data via a TCP port, and tell the ra* tools to pick the data up from the daemon when the daemon IP address is passed to them using the -S option.
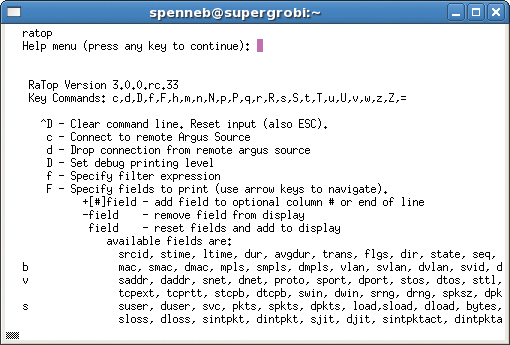
ratop also supports live analysis of your data. The command only needs a single argument: ratop -S Remote-Host. It opens a connection to the machine with the daemon, reads, and then displays, the data. ratop automatically sorts the connections by the number of packets transmitted, although other orders are possible. Calling the tool with the h flag (Figure 3) displays the keyboard shortcuts that ratop supports.
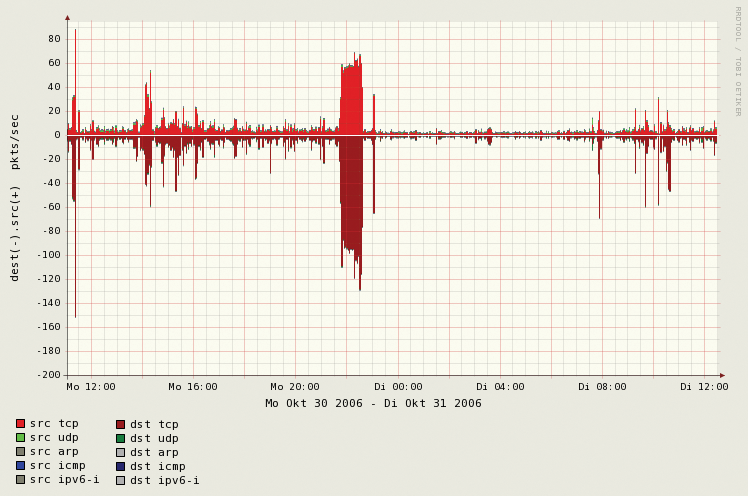
Argus also supports graphical analysis of your network data. For example, the following commands will give you a graphical analysis of the specified ports.
To save some space, I have left out the legend in Figure 4. The blue lines in the figure show HTTP connections, and the gray lines in the figure give you HTTPS. Also, the received data is shown in the positive area of the Y axis, and the transmitted data is shown in the negative number space.
ragraph bytes dport -nn -M 1m -r argus.out -w ./ports.png
Below, Figure 5 graphically illustrates an analysis of the protocols that are used in the "Protocol Distribution on the Network" box by ragraph:
ragraph pkts proto -M 1m -r argus.out -w ./proto.png
You could easily detect an increase in ICMP or IPv6 traffic here, and you might also suspect something fishy, because the data could be indicative of a tunnel or an attack - both protocols can easily be misused to hide malevolent data. Administrators can also evaluate the round-trip time for TCP connections (tcprtt), and the packet loss (sloss, dloss).

Although many of Argus' features, such as graphical analysis, are possible with other tools like ntop and MRTG, the granular flow data storage that Argus provides does give administrators the ability to take a closer look at suspicious data, whereas ntop and MRTG do not give you the original data to help you conduct a detailed analysis.
| INFO |
|
[1] Ntop: http://www.ntop.org
[2] Argus homepage: http://www.qosient.com/argus/ [3] CANINE: http://security.ncsa.uiuc.edu/distribution/CanineDownLoad.html [4] Argus release candidate: ftp://qosient.com/dev/argus-3.0/ |
| THE AUTHOR |
|
Ralf Spenneberg is a freelance Unix/Linux trainer, consultant, and author. His company, OpenSource, provides training and consultancy services. Ralf has published a number of books on the topics of intrusion detection, and virtual private networks. His new book, Linux Firewalls with Iptables & Co. was published just a few months ago. |