By Michael Schilli
If you program in Perl rather than in C or C++, you will probably be grateful for a few things that Perl takes off your hands: memory allocation, counting references, watching out for rogue pointers, freeing up memory - these labors of Sisyphus are offloaded from the developer's desk by Perl's virtual machine, helping developers to keep focused on the implementation.
Down below in the engine room, things can start to go awry. Although you will rarely make the acquaintance of a bug in a Perl release that actually takes down the C-based virtual machine, add-ins programmed by unwary C/C++ developers can trip you up.
The script in Listing 1 uses a C extension to deliberately take down the interpreter with a segmentation fault. To do so, it uses the Inline CPAN module, which compiles the attached C code and embeds it dynamically in the script. The C code after the __END__ tag sets a pointer to an address of 0xcba00000, and then it tells the strcpy C function to overwrite the protected kernel address on machines that use the 32-bit x86 architecture. The CPU notices what happened to the script and triggers an interrupt, at which point the Linux kernel pulls the rug out from underneath the offending program's feet.
| Listing 1: crash |
01 #!/usr/bin/perl -w
02 use strict;
03 use Inline "C";
04 use Inline Config =>
05    CLEAN_AFTER_BUILD => 0;
06
07 c_crash(43);
08
09 __END__
10 __C__
11 int c_crash( int num ) {
12  char *cp = 0xcba00000;
13  strcpy(cp, "Ouch!");
14 }
|
Figure 1 shows you how to call the Perl script to reproduce the error in the GNU debugger, gdb. The calling binary is the Perl interpreter, so the debugger will launch with gdb perl. To allow the interpreter to process the Perl crash script, just call the run crash command in the debugger. After the crash, gdb will give you the C code for the line that caused the crash. The debugger bt (for backtrace) command (you could use where as an alternative) also shows the hierarchy of the calling C function as a stack trace.

To allow the debugger to map the functions to lines in the C source code, you need to compile Perl with the -g compiler flag for troubleshooting support. When the Configure script prompts you to decide which optimizer/debugger flag should be used, say -g in response, or use the following Configure command line: ./Configure -D optimize=-g -d.
If you fail to do this, analysis becomes tricky due to the lack of references to the C source code, and if the executable has been stripped, you have little to work with; let's leave this interpretation of disassembled assembler code in the hands of long-bearded gurus!
You can extract information from Perl compiled in the normal way. Although the post-mortem is slightly more difficult, a trick, which I will explain later, can help you avoid excessive hex juggling.
If a crash occurs in a running program, the Linux kernel will normally create a core file. If not, you may find that bash is preventing core dumps due to the default setting of ulimit -c 0. If you change this to ulimit -c unlimited instead, you will find a core file (core or even core.xxxx with the pid attached):
$ ./crash
Segmentation fault (core dumped)
$ ls -l core.*
-rw------- 1 mschilli mschilli 1658880 Nov 3 21:30 core.1234
The core dump is normally stored in the directory where the program was called, unless /proc/sys/kernel/core_pattern says to do otherwise. If you want to find out what caused the crash, run the debugger against the executable and the core file (as in gdb perl core.1234). Your debugger session should look something like Figure 1, and you will be able to do a stack trace at a point just before the crash occurred. What you can't do, however, is actually execute this memory snapshot.
The stacktrace in Figure 1 tells us that perl crashed in a file called crash_3e35.xs (Line 7) inside a C function called c_crash() while trying to executed the C strcpy() function. If you now use the debugger's print cp command to check the target address, a value of 0xcba00000 is returned. This explains the crash to the investigating detective.
However, gdb only tells you about the goings on at C level. How can you find out which Perl script and which line the crash occurred in? To do so, you will need to analyze Perl's C data structures, which will give you some insight into the status of the virtual machine at the time of the crash.
How can you ascertain that c_crash was called with an argument of 43? To do so, you need some knowledge of the internal workings of Perl, which you can glean from the perlguts and perlhack manpages. Perl's virtual machine pushes function arguments onto the stack, in a similar style to a C compiler, before they are called by a Perl function. The PL_stack_sp variable points to the tip of the argument stack, and this is also where the value of 43 is represented as one of Perl's SV (Scalar Value) structures. To extract the integer value, you must cast PL_stack_sp->sv_any to (XPVIV*); it will return the numeric value of the argument passed in to c_crash() in its xiv_iv member:
(gdb) p ((XPVIV*)PL_stack_sp->
sv_any)->xiv_iv
$1 = 43
The gdb debugger can also notch into an active process. In this case, it automatically stops the process for a short time, and then steps through it when requested to. This is particularly useful when a Perl process hangs, and you have not implemented logging.
The Perl program in Listing spinner only calls an infinite sleep() loop and outputs its process ID and the time in seconds since the epoch. If the process ID is 1234, calling gdb perl -p 1234 will latch onto the active process. Instead of the command-line debugger, we will use the GUI-based version, ddd. You can see the debugger in Figure 2, and your distribution should include it. ddd understands gdb command-line options, so you can replace gdb with ddd in the previous command line. You are likely to catch the Perl process sleep()ing.

The up tells the debugger to jump up to the next highest layer of stackframes, that is, to move up in the function call hierarchy. Four levels further up, the source code window shows the short while loop running the opcodes for a script in the Perl interpreter (Figure 2). These opcode structures are the building blocks that Perl programs are built with, after the compiler has read the source code from the script.
Let's try to find out what type the global PL_op variable, which you can see here, is. Considering the excessive use of macros in the Perl kernel, this can be quite difficult to do. gdb can help:
(gdb) whatis PL_op
type = OP *
A print *PL_op command in the lower gdb window shows the content of the data structure. PL_op is a pointer to a structure, and the asterisk * tells gdb not to display the address, but rather the content of the data structure. For a permanent graphic display of the opcode data in Figure 2 in the top window of ddd, you need to enter graph display `p PL_op` in the gdb window, and then double-click the hex address (it's underlined in blue) in the top display of the opcode box that appears. This tells ddd to expand the data structure hiding behind this address, and display its attributes in the new, larger box on the right.
The output for the OP node reveals more than just pointers to following OPs and an address for the code to be executed; there is also a op_type field, which tells us the opcode type.
| Listing 2: spinner |
#!/usr/bin/perl -w
02 use strict;
03
04 while(1) {
05     function(time);
06     sleep(1);
07 }
08
09 sub function {
10     my($time) = @_;
11
12     print "$$: $time\n";
13 }
|
To display the opcodes for an active Perl program, you must define the following actions for the breakpoint set in Figure 2 by a mouse click near the code line:
commands 1
silent
p PL_op->op_ppaddr
cont
end
In this case, we want the stop at the first breakpoint (this explains the 1), but not to output line/code information (silent); instead we need the address and name of the function that implements the opcode (PL_op->op_ppaddr). The cont command that then follows tells gdb to carry on through the list of opcodes without waiting for user input. The lower command window in Figure 2 shows the outputs, after the process has been continued (cont) following the breakpoint definition.
To analyze rogue Perl programs at runtime, nextstate type opcodes are probably our best bet. They tell us which Perl package and line of the original Perl code the virtual machine is running.
nextstate opcodes always have a type number of 174. So, let's delete the old breakpoint by entering delete 1, and set a new breakpoint, again at the end of the while loop:
(gdb) break if PL_op->op_type
== 174
(gdb) display Perl_op_dump
(PL_op)
The if condition that follows the break tells gdb not to stop unless Perl is processing a type 174 opcode. The display command defines an action that gdb will perform after each break. This is particularly useful for outputting variable values.
The C Perl_op_dump() function accepts the internal data structure of the Perl opcode as input, and uses printf to output the opcode's properties. The function comes from the Perl interpreter, and is used by Perl developers to debug unstable developer versions. For analysis, gdb will easily run functions located somewhere in the executable you are investigating (or in its libraries), so it makes sense to debug with existing functions.
Even in a Perl program compiled without the -g flag, that is, a program that does not contain debug information, you can ascertain the line of Perl code that is running right now. However, in this case, gdb does not know that PL_op is an OP type variable, or that it has a op_type attribute. You could calculate the offset from op_type to the start of the PL_op structure, and then, using the Endian-ness of the Intel processor (least significant byte first), you can calculate the value of the op_type attribute, and compare it with 174.
However, you might prefer to use a more simple trick: let's put together a shared library based on the optest.c listing shown on the previous page, and use the perl_compile script to compile it. Perl stores the compiler options and the parameters used to configure it, and makes them available via the Config module. If you compile a Perl extension, you are able to quickly set the correct compile options and include paths.
This steps in Figure 3 give us a shared library titled optest.so, which contains nothing but a global pointer variable, my_special_op, of OP type. This variable will contain the address of the OP * type opcode pointer, PL_op, later. As we compiled the shared library using -g, gdb will know the my_special_op data structure, which gives us a workaround for querying the value of PL_op->op_type.
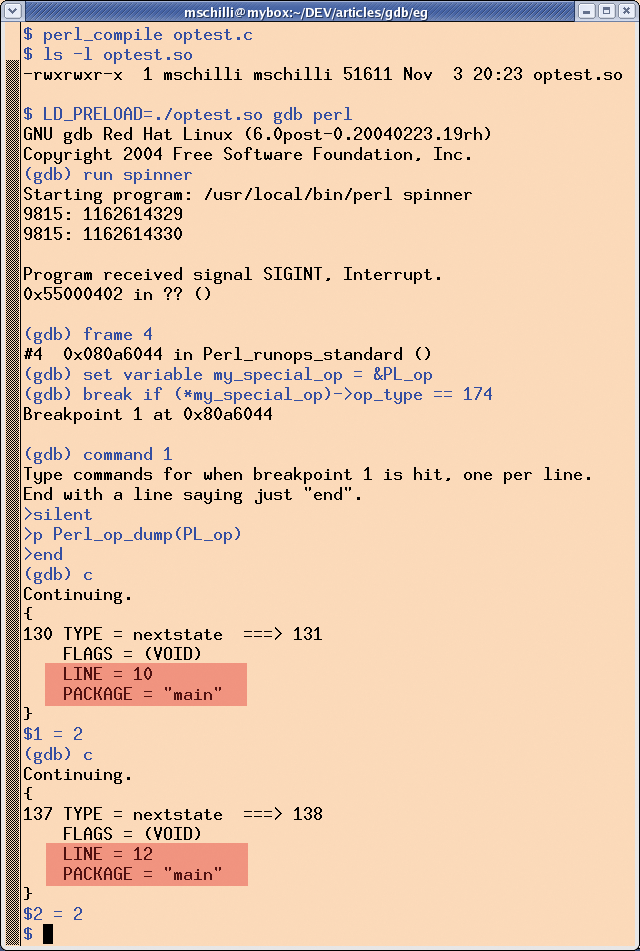
To allow this to happen, we need to load the test library before the executable itself, using LD_PRELOAD, as shown in Figure 3.
After defining the breakpoint with the known condition, and the output command, the display shows Perl processing Line 10, and then Line 12, of the main program after the break. Counting the lines reveals that these are the first and second lines of code in function() in the spinner Listing.
Note that the nextstate opcode does not directly reveal the file name of the Perl script that is being processed. Instead, it provides the filename of the Perl package. If this happens to be "main", we know the interpreter is in the main program. If the name is "LWP::UserAgent", for example, you can typically find which file defines the package using perldoc -m LWP::UserAgent.
After locating the problem with this approach, troubleshooting is often trivial. Also, a carefully crafted logging strategy can help facilitate analysis of the next problem.
For more in-depth information on the analysis techniques introduced in this article (in addition to many other techniques), check out [2], an incredible piece of work that all developers should have on their desks.
| Listing 3: optest.c |
01 #include "EXTERN.h" 02 #include "perl.h" 03 #include "XSUB.h" 04 struct op **my_special_op = NULL; |
| Listing 4: perl_compile |
01 01 #!/usr/bin/perl -w
02 02 use strict;
03 03 use Config;
04 04
05 05 my($file) = @ARGV;
06 06 die "usage $0 file.c" unless defined $file;
07 07 (my $solib = $file) =~ /\
08      s.c/.so/;
09 08
10 09 my $cmd = /\
11     "gcc -shared -o $solib " .
12 10  "$Config{ccflags} -g -fpic " .
13 11  "-I$Config{archlibexp}/CORE $file";
14 12
15 13 system $cmd;
|
| INFO |
|
[1] Listings for this article: http://www.linux-magazine.com/Magazine/Downloads/75/Perl
[2] "Self-Service Linux", Mark Wilding and Dan Behman, Prentice Hall, 2006 |