
By Caspar Clemens Mierau
Has your server been cracked? Are your processes running wild? If you suspect an intrusion, you'll need accurate information on what's happening with the system. Open file handles are a useful source for this information. lsof [1] scans the depths of the filesystem for these files and then returns comprehensive and detailed output.
To be fully prepared for an attack, you'll need an Intrusion Detection System (IDS) like Snort, Tripwire or Aide to check the filesystem and data streams for suspicious patterns. However, if you don't have the time or resources for a full-blown intrusion response, Linux has a number of standard command line programs capable of discovering tell-tale traces on a system. The usual suspects for server diagnosis are ps, netstat, top, fuser, and other friendly helpers.
lsof is a single tool that provides a summary of similar system information. You can use lsof as a single source for obtaining information that would otherwise require a whole collection of admin utilities.
As the adage goes, "everything is a file" in Unix. Almost all activities on a Unix-like system bear some relation to an open file. Unix-style systems use regular files, special block files, executables, libraries, directories, internal data streams (Unix Domain Sockets), and network connections. lsof is able to centrally collect and synthesize all this information into meaningful clues about the nature of an attack.
Like any utility, lsof is subject to manipulation once the attacker has gotten comfortable. If you are serious about using lsof for intrusion detection, leave out the make install step after compiling and manually move the binary to a write-protected medium such as a CD ROM. Of course, if a sophisticated attacker has directly modified the kernel (through a kernel rootkit, for example) the output of lsof will be unreliable even if the tool itself is untouched. However, as you'll learn in this article, many attackers try tricks that aren't especially sophisticated and are easily exposed with a tool like lsof.
lsof is no substitute for a full-featured IDS, but if you are too late for that or if you aren't interested in implementing or managing a more comprehensive system, you can still use lsof to look for footprints.
| Finding and Building lsof |
|
Lsof supports a number of Unix derivatives, and it is probably part of your basic Linux system, or at least it should reside in the standard repository. To install on Debian, for example, you just need to issue a apt-get install lsof command. The lean package has no dependencies, apart from the mandatory Libc 6. This said, there are two reasons for avoiding the prebuilt binary: system compatibility and security. As lsof's developer Vic Abel points out in the FAQ [2], you can only guarantee a full feature set and optimum stability, if you build the current lsof version on the target machine, since lsof digs deep into the system architecture and kernel. It is always better to obtain tools you will be using for preventive or forensic analysis from a safe source and not to mix them with standard system tools to avoid the danger of manipulation by rootkits. The lsof sources are easily compiled, so you might as well build a version that matches your system. The commands in Listing 1 grab the sources of the network; use GnuPG to check the signature (note that the key in our example was obtained from an insecure source), configure the source code, and compile it. During the configuration phase, you are prompted to make a few decisions. The HASSECURITY and HASNOSOCKSECURITY options are important. If you would only like the root user to be able to use lsof to list open files and sockets for all users, you need to answer [y] and [n]. The inconsistent terminology does tend to be confusing. On completing the build, ./lsof -v tells you the options it was compiled with. The Only root can list all files message means that normal users will be unable to misuse the program to list system-critical information. (Restricting access to lsof is a rather cosmetic security solution, since much of the information available through lsof can also be obtained with tools such as ps and netstat, although the process may not be quite as convenient. The prebuilt versions in various distributions handle security differently. Debian grants non-administrative users unrestricted use of lsof, whereas Red Hat Enterprise applies restrictions. |
| Listing 1: Compiling lsof |
01 wget ftp://lsof.itap.purdue.edu/pub/tools/unix/lsof/lsof.tar.bz2 02 tar xjf lsof.tar.bz2 03 cd lsof_4.77 04 wget ftp://lsof.itap.purdue.edu/pub/Victor_A_Abell.gpg 05 gpg --import Victor_A_Abell.gpg 06 gpg --verify lsof_4.77_src.tar.sig lsof_4.77_src.tar 07 tar xf lsof_4.77_src.tar 08 cd lsof_4.77_src 09 ./Configure linux 10 make -s 11 ./lsof -v |
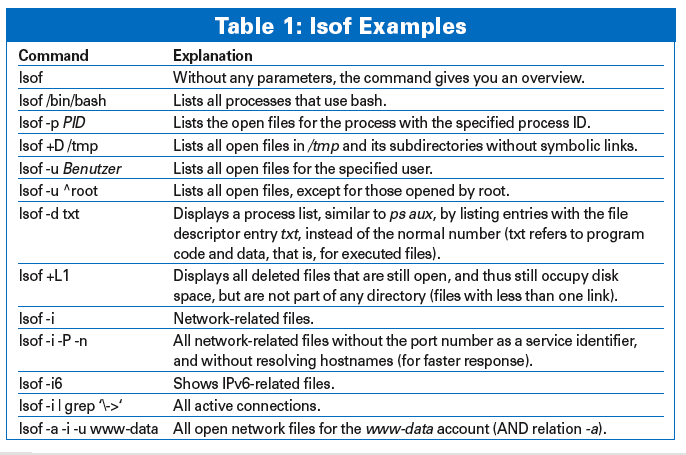
Table 1 lists a number of examples for investigating a system. If you enable lsof's security option, only root will receive detailed output for these commands. In secure mode, lsof will only show users the details that directly affect them, however, even in insecure mode, lsof gives users without root privileges fewer details, as you need root privileges to access the details in /proc.
lsof uses a tabular format to output the information filtered as specified by the parameter list, including the following columns by default:
You can manipulate the output for processing with other tools using lsof -F. Special formatting helps the downstream tools parse the individual fields (see the manpage section Output for other programs for details).
Calling lsof without setting parameters returns too much information to provide a useful overview - the flood of information would scare off many users. However, command line parameters can help lsof concentrate on the data you need. If you combine multiple parameters, lsof assumes a logical OR operation by default; however, you can specify -a for an AND operation (last line in Table 1).
Identifying processes that are preventing users from unmounting a storage medium is a typical task for lsof. Calling lsof with the -t directoryname option returns a list of numeric process IDs accessing the CD-ROM:
$ umount /dev/cdrom
umount: /cdrom: device is busy
$ kill -9 `lsof -t /dev/cdrom`
$ umount /dev/cdrom
$ eject
However, this method is as drastic as it is effective.
The commands listed in Table 1 are fine for discovering important facts about a system before or after an attack. To defend yourself against invaders, you need to be familiar with the normal status, and to be aware of where suspicious entries are likely to appear.
The following example uses a traditional LAMP system (Linux, Apache, MySQL, PHP). The administrator notices an enormous increase in network load that doesn't reflect the number of page hits. The administrator suspects that an attacker has injected a trojan that copies files over the wire, launches distributed network attacks or sends spam mail. In a LAMP environment, the PHP system interface is one of the major targets, as PHP suffers from a couple of design weaknesses [6], but poorly crafted scripts can just as easily give an attacker a foothold.
If you are familiar with typical PHP attack patterns, you will probably already have guessed what kind of information you need to look for with lsof.
The Apache web server runs under its own user account by default, www-data (Debian), apache, httpd, or if the worst comes to the worst, nobody (this account is normally reserved for NFS). Typically, additional processes will run as root to support privileged ports and to be able to open log files. In contrast to this, data communications are handled by unprivileged processes. Thus, a web server offers a guessable configuration of users, executable files, and open ports. For example, www-data runs /usr/sbin/apache2 on Debian.
In this context, we need a call to lsof -a -d txt -u www-data to list processes that execute the file /usr/sbin/apache2 as the www-data user account. The -a option gives us a logical AND, -d txt lists executed files only, and -u www-data restricts the output to just one user. Under normal circumstances, this will give you just the Apache processes.
If an attacker manages to manipulate PHP or your PHP scripts and execute system commands and programs on the server, these commands and processes will typically run under the same account as Apache - that is, unless the attacker has escalated his privileges and gained root access by exploiting other security holes.
Finding processes that belong to the Apache user and that also access other binaries or open unexpected ports, should set off the alarms. lsof -p PID investigates the suspicious processes for details of network connections, libraries that have been loaded, open files, and many other things.
As malevolent hackers tend to use their own FTP, IRC, telnet, or SSH servers, initial analysis should include searching for open ports. The lsof -a -i -u www-data | grep LISTEN command lists all the IP sockets (-i), which sockets the Apache user has opened, (-u www-data), and which are listening for connections (this explains grep LISTEN).
Everything apart from 80 (HTTP) and 443 (HTTPS) is suspicious. Although a call to netstat will give you similar results, lsof can help you perform more detailed analysis without needing to switch to another tool.
Apache and PHP exploits are fairly common. Listings 2a and 2b show two excerpts from the lsof logs on compromised servers, and they are all I need to diagnose an attack. The output results from analyzing processes belonging to the www-data account. See Listing 3 for another abridged example.
In the first example, the attacker exploits an obsolete version of W-Agora (online forum software) and a directory without write protection (Listing 2a, Line 2: /home/user/public_html/w-agora/).
| Listing 2a: Bash Camouflage |
01 COMMAND PID USER FD TYPE DEVICE SIZE NODE NAME 02 bash 30334 www-data cwd DIR 3,8 4096 1571340 /home/user/public_html/w-agora/.m 03 bash 30334 www-data txt REG 3,8 496231 1571405 /home/user/public_html/w-agora/.m/bash 04 bash 30334 www-data 0w REG 3,8 125 1571408 /home/user/public_html/w-agora/.m/LinkEvents 05 bash 30334 www-data 2u IPv4 4709341 TCP server.com:40001->undernet.xs4all.nl:ircd ESTABLISHED) |
The attacker has created a new directory .m to use as a working directory (Line 2, Column FD: Current Working Directory). The attacker has uploaded C files to the directory and then compiled and executed the files using a harmless-sounding account name of bash.
However, as you can see in Line 5, the programs are not as harmless as the name might suggest; this bash has an open connection to an IRC server. Plus, bash has written data to the LinkEvents file, which is obvious from the file descriptor 0w (that is, bash has opened stdout for writing).
| GUI Tools |
|
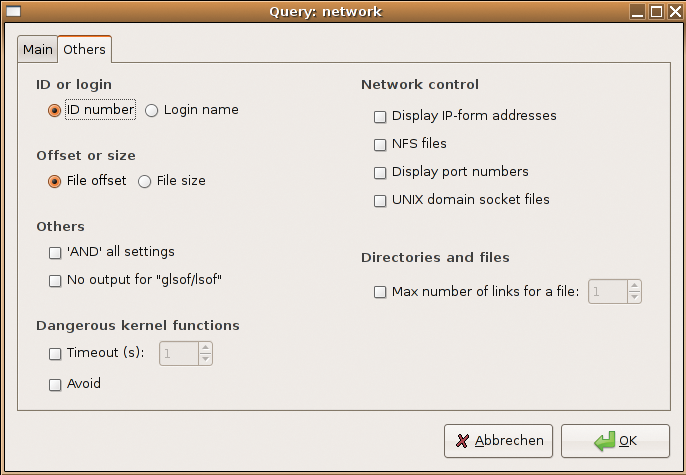
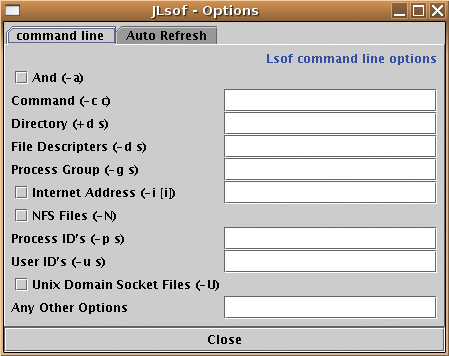
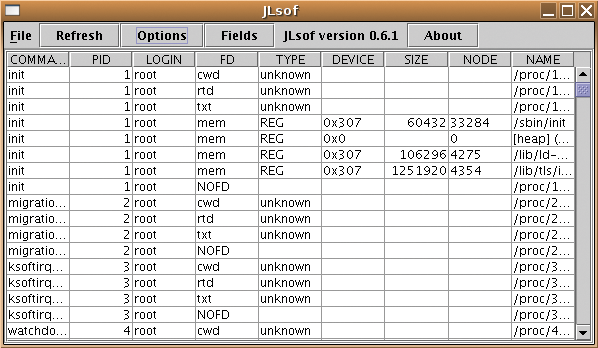
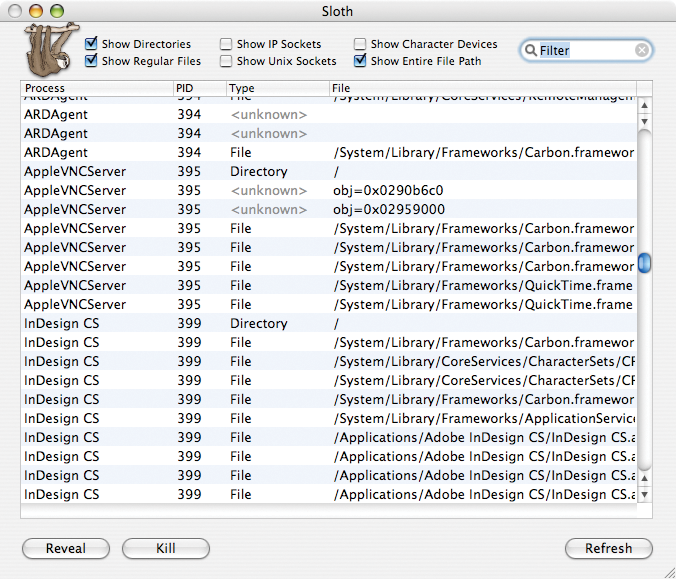
GUI fans may find it hard to locate a graphical front-end for lsof. The Libgnome-based glsof tool [3] is fairly new, and its developers are still extremely busy, although they have not made it past the alpha stage thus far. The release cycles are fairly short, so you might like to download the latest version from the Subversion repository. This actually turned out to be the only way to get things working in our lab. The glsof homepage has the usual howtos, and the developers will answer your email if you get stuck. Glsof gives users the ability to set filters by pointing and clicking (Figure 1) and to store the settings so that they can run the same queries later. Filters support fairly complex rulesets, which you can view and analyze in the query debugging window. Thus, glsof considerably shortens the learning curve for lsof newcomers. The ability to set up file monitors in glsof, to watch freely definable resources, and to notify administrators in case of access is also useful. Under the hood, all glsof does is repeatedly call lsof, which lists access for the point in time when it was called. As this approach is not event-based, glsof can easily overlook short-term access. The fairly ancient Java front-end, JLsof [4], which has not been updated since 2003, has less in the way of functionality than glsof, but it also has fewer dependencies. To install JLsof, you need to download and unpack the archive. You may need to modify the path to the Java interpreter and to lsof in the jlsof start script. JLsof has a far more spartan look than glsof, but it does show you how your filter settings resolve to lsof command line parameters (Figure 2), which is a good thing if you are trying to understand the filter rules. Although you can't actually store filters, JLsof will export the output (Figure 3) to an XML document. If you use a Mac, there is no need to do without a native lsof GUI. Sloth [5], which was written in Objective C, scores with a nicely organized interface (Figure 4) that offers predefined filters categorized by resource type and the ability to terminate processes by clicking with the mouse (kill). |
Our cyber criminal is really cheeky, but the attacker's methods reveal more self-confidence than technical ability - especially considering the fact that he has not bothered to cover his tracks. Hiding the directory by starting the directory with a dot and using bash as the account name for the processes, are both beginner's tricks.
In the second example (Listing 2b), the attacker has found a similar security hole and installed several applications. Again, the attacker has not taken the trouble to cover up; the www-data account has a number of open ports, including on the Psybnc IRC proxy. The unique process name of psybnc (Lines 5 through 8) is a real give-away, but at least there is an attempt to hide the processes behind a familiar name - as the name server bind in Line 9.
In fact, this is a patched SSH server that grants system access to www-data without requiring a password. There also is a server process with the suspicious name of a (see Lines 2 through 4).
| Listing 2b: Injecting an IRC Proxy |
01 COMMAND PID USER FD TYPE DEVICE SIZE NODE NAME 02 a 10555 www-data 266u IPv4 2808 TCP *:https (LISTEN) 03 a 10555 www-data 267u IPv4 2809 TCP *:www (LISTEN) 04 a 10555 www-data 543u IPv4 757852768 TCP *:9713 (LISTEN) 05 psybnc 10615 www-data 266u IPv4 2808 TCP *:https (LISTEN) 06 psybnc 10615 www-data 267u IPv4 2809 TCP *:www (LISTEN) 07 psybnc 10615 www-data 543u IPv4 757871322 TCP *:ircd (LISTEN) 08 psybnc 10615 www-data 549u IPv4 762054917 TCP server.com:35614->oslo1.no.eu.undernet.org:ircd (ESTABLISHED) 09 bind 22004 www-data 543u IPv4 696149859 TCP *:1982 (LISTEN) |
You may have the need for a script that compares a known system status with the current status and responds in a predefined way in case of deviations - that is, an anomaly detection system. With lsof, it makes sense to monitor a list of open ports, adding process names, usernames, and interfaces.
The command shown in Line 1 of Listing 3 handles the first part of this task in an elegant way. It tells lsof to output network-related files (-i) without writing out the port numbers as service names (-P) and without resolving IP addresses to hostnames (-n). Awk checks the output for listening ports (LISTEN status) and formats the output as: username/processname/IP:Port, where an IP address of * stands for a server that listens to all interfaces.
| Listing 3: Open TCP Ports |
01 $ lsof -i TCP -n -P | awk '/LISTEN/ {print $1"/"$3"/"$8}' | sort -u
02 apache/root/*:443
03 apache/root/*:80
04 apache/www-data/*:443
05 apache/www-data/*:80
06 mysqld/mysql/127.0.0.1:3306
07 sshd/root/*:22
|
The final sort organizes the output in alphabetical order, and -u ensures that each combination of user, process, and service occurs only once.
The output shown in Line 2 of Listing 3 was taken from a Debian Sarge server with Apache 1.3, MySQL, and an SSH daemon. In our example, MySQL only binds to the local interface (Line 6), while Apache and SSH are accessible via any interface.
The grouping of the Apache processes in root and www-data, which results from dropping root privileges after launching the program, is characteristic for the web server.
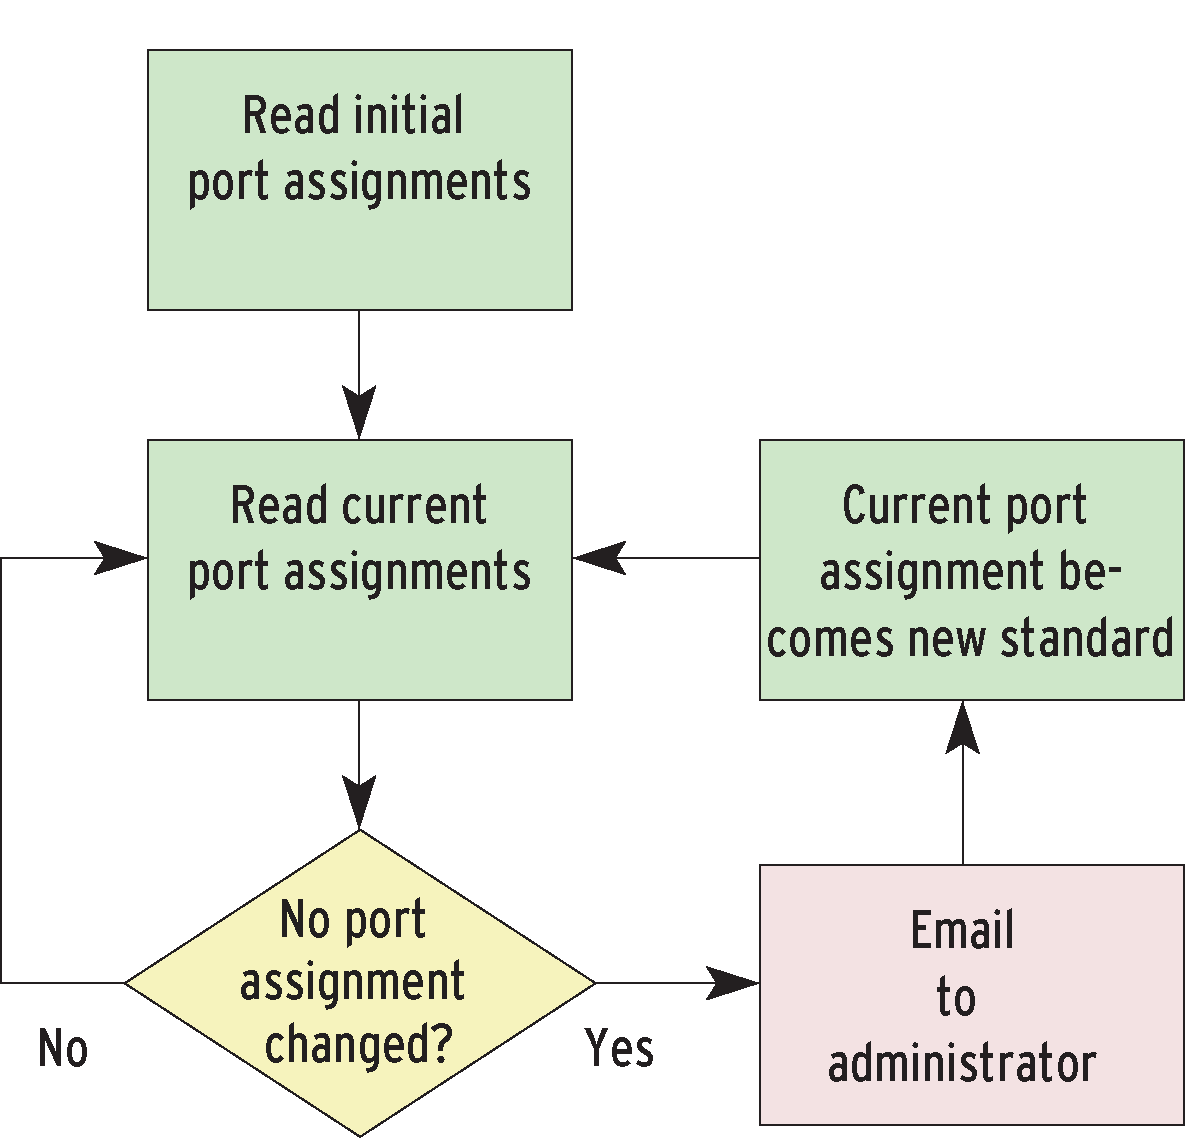
The miniature lsof-based IDS in Listing 3 works as depicted in Figure 5. When launched, the script remembers (Listing 4, Lines 4 through 8) the current port configuration. Every 10 seconds, it calls lsof to fetch the list of open ports and compares the list with the last known status (Line 12). If a change occurs, the script mails the before/after status (Lines 14 through 0) and uses the new status for further comparisons (Line 22).
| Listing 4: Port Monitoring |
01 #!/bin/bash
02 MAILTO="root"
03 HOSTNAME=`hostname`
04 getports() {
05   lsof -i -n -P | awk '/LISTEN/ {print $1"/"$3"/"$8}' | sort -u
06 }
07
08 OLD="$(getports)"
09 echo -e "Start with following port assignments:\n$OLD"
10 while sleep 10 ; do
11   NEW="$(getports)"
12   if test "$OLD" != "$NEW" ; then
13     echo "Port assignments changed! Notify administrator by email"
14     mail -s "Attention: $HOSTNAME LISTEN status changed" $MAILTO <<EOF
15 Status prior to change:
16 $OLD
17
18 Status after change:
19 $NEW
20 EOF
21   fi
22   OLD="$NEW"
23 done
|
To test your do-it-yourself anomaly detection system, you might like to temporarily open a port. Netcat offers an easy way to do so. Give a command like nc -l -p 12345 to launch Netcat in LISTEN mode (-l) and keep port 12345 open. Within 10 seconds, the shell script in the infinite loop should have noticed the status change and responded accordingly.
Be aware that some processes change lsof's view of the port assignments. For example, some email servers fork additional processes, depending on the status of the incoming connection. Under certain circumstances, processes like this can cause false alerts, although it's fairly easy to avoid by modifying the logic behind the query. Adding | grep -v temporary service in Line 5 should do the trick.
A simple shell script can't hope to replace a full-fledged IDS, but if you're looking for a no-frills detection tool or an extra line of defense, lsof could be a part of the solution. Useful additions might be cryptography-based configuration management in the style of Aide, checks on executed files, evaluation of the UDP configuration, and many other things. Repeated calls to lsof can also open up new fields of application, as evidenced by the file monitor options in Glsof. Whether you script with lsof or use it as a fast, universal administration tool, lsof is an easy, if limited, tool for spotting intruders.
| INFO |
|
[1] lsof homepage on Freshmeat: http://freshmeat.net/projects/lsof/
[2] lsof FAQ: ftp://lsof.itap.purdue.edu/pub/tools/unix/lsof/FAQ [3] Glsof: http://glsof.sourceforge.net [4] JLsof: http://www.geocities.co.jp/SiliconValley/1596/jlsof/readme.html [5] Sloth: http://www.sveinbjorn.org/sloth/ [6] Hardened PHP: http://www.hardened-php.net |