
By Tim Schürmann
Graphviz is a useful toolbox to have on hand if you need an automated approach to generating graphs (see the "Terminology" box). Computer users fumble through generating graphs, starting with E/R diagrams for visualizing database schemas to hierarchicial tree structures that represent an organization's shareholdings or a chain of command. Normally, the information is located in square boxes that must be positioned carefully, without overlapping with other boxes, before drawing anyconnecting arrows. This is the kind of challenge in which Graphviz excels - users simply specify the relationships between the elements, and the tool automagically outputs an attractive drawing. Don't look for a neat graphical editor in which you can specify the relations. Instead, Graphviz reads a text-based description of the graph in a special markup language. (LaTeX uses a similar approach, although the two systems have nothing in common apart from this.)
Graphviz has been included with all popular Linux distributions for years now. Installing the package is simple - just point and click in your favorite package manager. You can also download the latest source code version from the Graphiz homepage [1] and follow standard procedure to build and install:
configure; make; make install
Whichever way you choose to go, you should have a collection of tools on your disk when you are done.
| Terminology |
|
A graph uses lines to connect multiple boxes. The boxes are referred to as nodes, and the lines as edges. An example of a graph might be a map of a freeway, where cities are nodes and the roads themselves are edges. A graph in which the links are represented by arrows is referred to as a directed graph (or digraph). Without the arrows, this would be an undirected graph. You could think of directed edges as one-way streets. There is a mathematically sound - and thus, slightly cryptic - way of expressing this. A (directed) graph: G = (V,E) comprises a set of nodes, and a set of edges (E), where the letter contains pairs of (directed) nodes of the form: e = (x,y) |
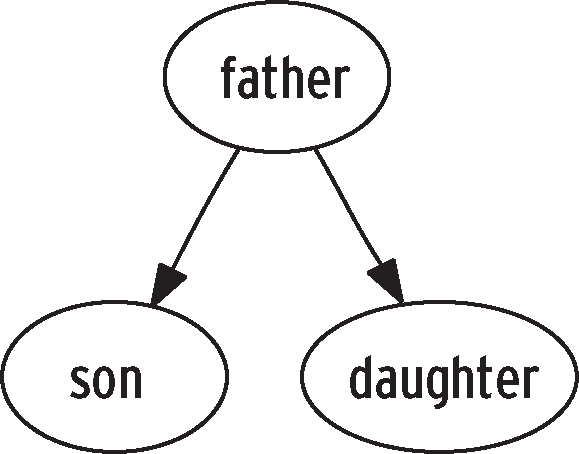
Before you can put the Graphviz tools through their paces, you need a description of the graph you want to create. To create a description, you need to write a text file in the dot language, which is simple to learn. For example, Listing 1 implements a simple, directed graph.
The description starts by defining a directed graph called G with three nodes: father, son, and daughter. In contrast to many other programming languages, there is no need to explicitly declare the nodes. You can just go ahead and use them. The arrows specify which nodes the edges connect. Loops are permitted. The following would point to itself:
father -> father
An optional semicolon terminates each line. As you can see from the parentheses, the syntax is modelled on that of the C programming language. C is also the source for comment tagging, which uses /* to open and */ to close a comment.
| Listing 1: example1.dot |
01 digraph G {
02   /* The father has a son and a daughter: */
03   father -> son;
04   father -> daughter;
05 }
|
To convert this description to a drawing, you now need to run the dot tool. Confusingly, the tool uses the same name as the markup language. The following command creates a PNG file (Figure 1):
dot -Tpng example1.dot-o example1.png
In addition to this, dot supports PostScript (-Tps parameter), JPG, Gif, Fig, SVG, and a number of other more or less exotic formats. Direct PDF output is not supported right now, but you can use the Ghostscript ps2pdf tool as a workaround. Don't forget to specify the -o along with a filename. If you do, the tool will send the output directly to the console. The same thing applies to the -T parameter; without the parameter, dot will simply output the text description of the drawing.
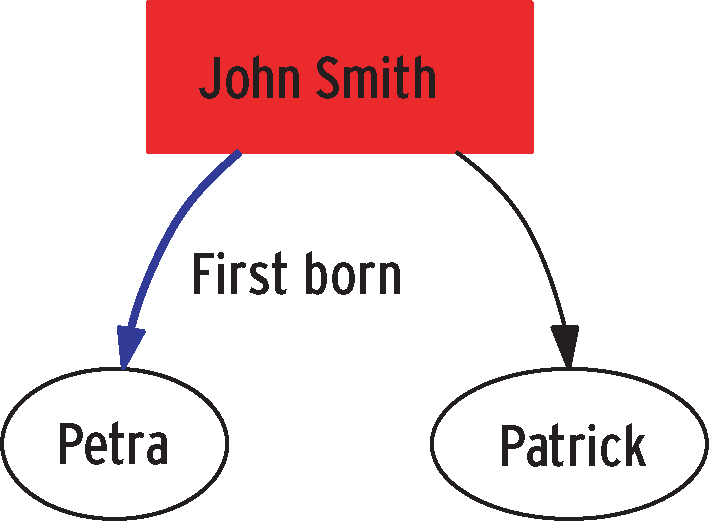
If the description does not contain instructions to the contrary, dot will create oval nodes labeled with their names. Let's change this in our example by adding the father's first and second names, using filled, red rectangles. The dot language has a number of attributes that will help us implement the changes. To modify a specific attribute, such as the color or the label, you just assign a different value to the attribute in question:
color = red
label ="John Smith"
You need to comma-separate the attributes and append them to the node name in square brackets. In the father's case, the syntax is as follows:
father [shape = box,style = filled, color = red, label ="John Smith"];
The next thing is to insert this line somewhere between the curly braces in the graph. The recommended approach is to define the nodes' appearance first, before going on to define the edges.
If this has worked for the nodes, you can rightly expect it to work for the edges. Just like nodes, users can color edges, change their line styles, or add labels. Again, all you need to do is to append pairs of values in square brackets to the edge in question, as in the following example:
father -> daughter [style = bold, label = "first-born", color = blue];
The family tree is shown in Listing 2, and the results after running dot against the description are shown in Figure 2.
| Listing 2: example2.dot |
01 digraph G {
02   father [shape = box, style = filled, color = red, label ="John Smith"];
03   daughter [label ="Petra"];
04   son [label = "Patrick"];
05   father -> son;
06   father -> daughter [style = bold, label = "first-born", color = blue];
07 }
|
Changing the shape of all the nodes in a large graph might sound like a lot of work. The dot markup language uses two keywords - node and edge - to facilitate the task. Changing the attributes of the keywords applies the changes to all elements in the graph. For example, the following:
digraph G {
       node [shape = box];
       ...
}
assigns a square frame to the nodes - unless the individual node contains attribute instructions to the contrary. The edge instruction does the same thing for the edges.
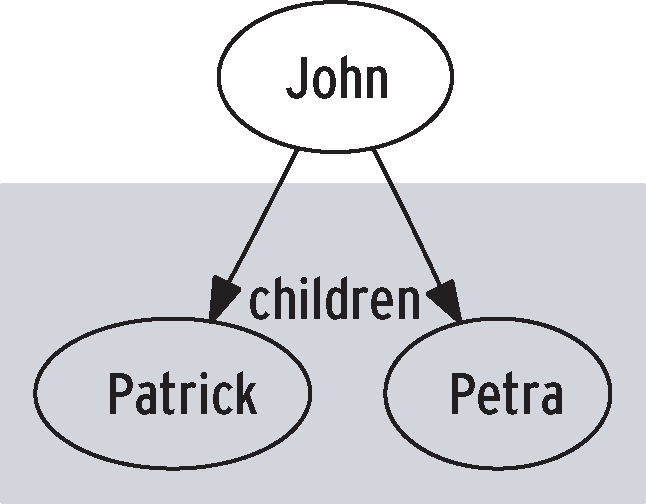
Subgraphs are also very useful. You can use them to group nodes that belong together. Listing 3 gives you an example.
In this case, we have introduced a subgraph that contains the daughter and the son. To tell dot to highlight the cluster in the output, you need to start the name with the cluster prefix. The other attributes belong to the subgraph; in this case, they define the color and the label. Figure 3 shows the results.
| Listing 3: example3.dot |
01 digraph G {
02   subgraph cluster_children {
03     style = filled;
04     color = lightgrey;
05     label = "Children";
06
07     daughter [label ="Petra"];
08     son [label = "Patrick"];
09   }
10
11   father [label = "John Smith"];
12
13   father -> daughter;
14   father -> son;
15 }
|
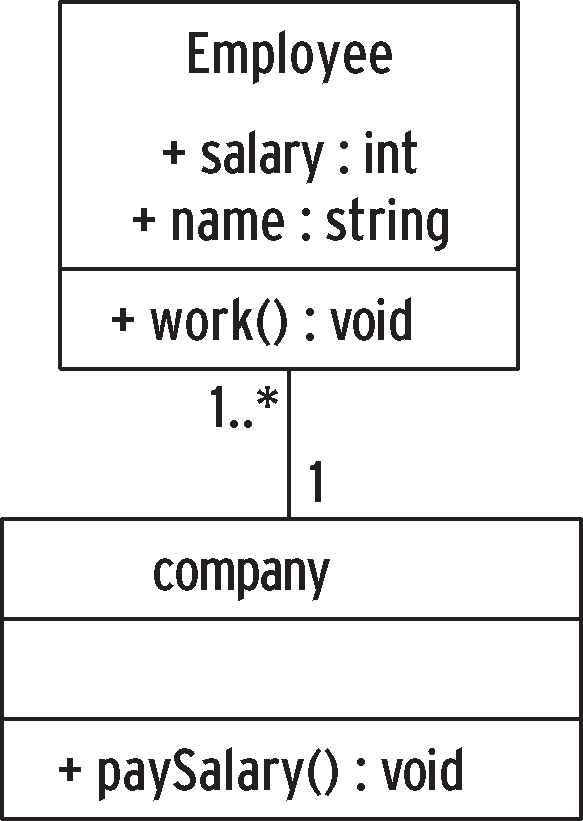
Thus far, nodes have just been assigned simple labels. However, the UML class diagram I referred to previously needs nodes with multiple subdivisions.
To do this task in dot, you will first need to switch the frame to a special mode - record:
node [shape = record]
From this point on in the code, dot will do something special with the label for this node, adding vertical lines to subdivide the node into multiple sections:
employee [label = "{Employee|+ salary : int\l+ name : string\l | + work() : void\l}" ]
The \l tags left justify the text, and the curly braces insert vertical bars. This gives us a more or less perfect representation of the UML class; all we need now are labels on the edges. In UML, the cardinalities can be positioned at both ends of an edge. To do this, you can use the headlabel and taillabel attributes:
edge [headlabel = "1", taillabel = "1..*" ]
For an example of a small UML diagram description, see Listing 4. Figure 4 shows the resulting diagram.
| Listing 4: UML Diagram |
01 digraph G {
02   node [shape = record] /* vertical lines in the label are drawn as lines */
03   edge [arrowhead = "none", headlabel = "1", taillabel = "1..*" ]
04   /* curly braces mean: drawn a horizontal line, and not a vertical bar (rotate the box through 90 degrees) */
05   employee [label = "{Employee|+ salary : int\l+ name : string\l | + work() : void\l}" ]
06   corporation [label = "{Corporation| | + paysalary() : void\l}" ] employee -> corporation
07 }
|
A record can do more than this, however. Users can use the divisions in the node to control the links to multiple subsequent nodes. Listing 5 and Figure 5 show you how this works. The angled brackets mark special points, known as slots, from which the arrows in the diagram emanate or terminate.

| Listing 5: Complex Links |
01 digraph G
02 {
03   node [shape = record];
04   /* The "Ports" are shown in square brackets */
05   father [ label ="<left> | <center> Father | <right>"];
06   son [ label ="<left> | <center> Son | <right>"];
07   daughter [ label ="<left> | <center> Daughter | <right>"];
08
09   "father":center -> "son":left;
10   "father":center -> "daughter":right;
11 }
|
Directed graphs are dot's speciality; if you need undirected graphs, you could use another tool from the collection - neato. Again, the tool expects dot descriptions; however, it only supports the graph keyword, rather than digraph. Directed edges are converted to undirected edges using -. Listing 6 shows an example. Figures 6a and 6b show the diagrams created by dot and neato.
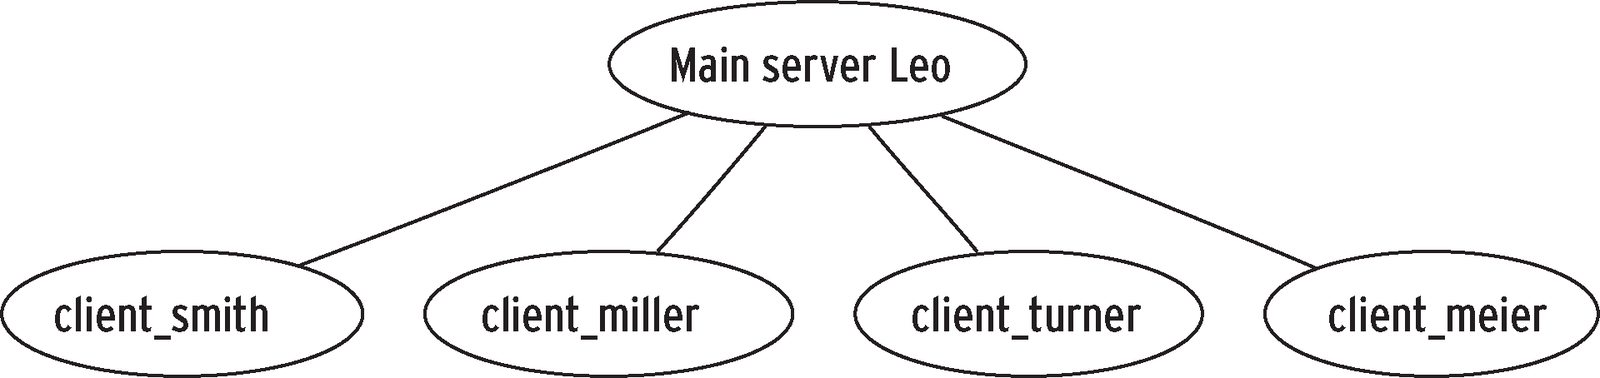
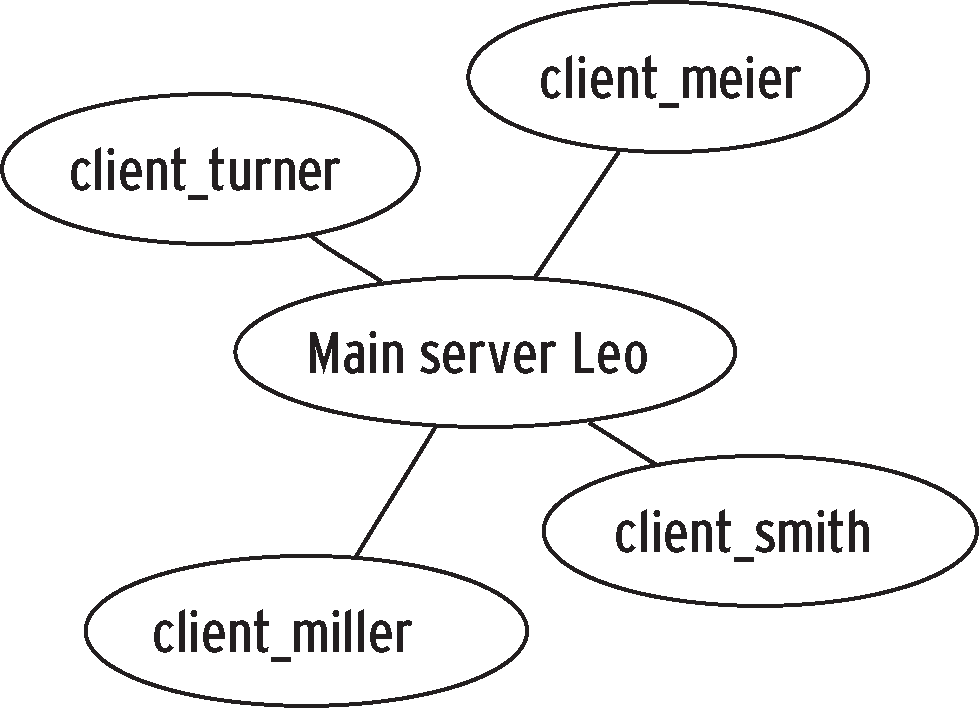
| Listing 6: Undirected Graph |
01 graph G {
02   server [label = "Main server Leo"];
03
04   server -- client_smith
05   server -- client_miller;
06   server -- client_turner;
07   server -- client_meier;
08 }
|
The Tools dot and neato use different drawing algorithms. While dot organizes nodes hierarchically, neato replaces edges with virtual springs and uses simulated gravity to calculate the correct distance between the nodes, thus creating a symmetric layout. The twopi and circo tools are also worthy of attention. They arrange nodes in a circular pattern; for more details on the algorithms that do this, refer to the Graphviz documentation [5].
With a little help from pipes and filters, the dot command-line tool can also be used for scripting or integrated with other Linux programs. To do so, you first need to prepare the graph description in a text buffer, then pass it into dot, and finally pick up the results. A shell script might do it this way, for example:
echo "digraph G {father->son; father->daughter;}" | dot -Tpng >example7.png
In this example, the output from dots is simply redirected to a file, but of course, this could be another (shell) script for additional processing.
The graphical editor, dotty, works in the same way. It is not particularly convenient, but it does let you click and point to create graphs.
If these features do not give you the options you need, you can always create a C program to access the functions in the Graphviz library. The library has convenient functions for parsing text-based files in dot format and dropping the results into a data structure designed explicitly for this purpose.
You can also manipulate graphs in memory and output the results. The program shown in Listing 7 gives you a brief example. It parses a text file with dot commands, draws a graph with a little help from the dot algorithm, and outputs the results. In fact, dot itself is built in a similar fashion.
| Listing 7: Graphviz C API |
01 #include <gvc.h>
02
03 int main()
04 {
05   GVC_t *context;
06   graph_t *graph;
07   FILE *fp;
08
09   context = gvContext();
10   fp = fopen("example.dot", "r");
11   graph = agread(fp); /* Parse graph */
12   gvLayout(context, graph, "dot"); /*Create layout with dot algorithm */
13   gvRender(context, graph, "png", stdout); /* Output graph in PNG format */
14   /*Clean up */
15   gvFreeLayout(context, graph);
16   agclose(graph);
17   gvFreeContext(context);
18 }
|
There are some more sample programs in the dot.demo directory that comes with the source code package. The Graphviz homepage has a comprehensive API reference. If you use the API for your own development work, note that the libraries are licensed under the Common Public License.
Once you have come to terms with the graph description language, dot, you will appreciate the tools in the Graphviz package. It is hard to find a faster way to create graphs. Thanks to pipes and filters, dot and company are easy to integrate with other sequences and shell scripts. Plus, if the package is not to your liking, you can check out the "Alternatives" box for similar tools.
| Alternatives |
|
The Graphviz programs expect a short description of the graph, which they then automagically convert into a drawing. This leaves users with few options for influencing the kind of results they get. If you appreciate the benefits a description language can give you, but would prefer to have more granular control over the position and shape of the individual elements in the graph, you might prefer one of Graphviz's competitors. Asymptote [2] and GLE [3], in particular, are worth noting. Both can be accessed from within LaTeX. XML-based languages, such as the popular SVG [4], follow a similar approach; however, there is very little in this line of software available right now. |
| INFO |
|
[1] Graphviz homepage: http://www.graphviz.org
[2] Asymptote homepage: http://asymptote.sourceforge.net [3] GLE homepage: http://www.gle-graphics.org [4] SVG format specifications: http://www.w3.org/Graphics/SVG/ [5] Information on the algorithms used by Graphviz: http://www.graphviz.org/Documentation.php |