
By Julian Hein
Some high-end network monitoring solutions sell for thousands of dollars, and they may well be worth the money if they can keep an enterprise-grade network functioning smoothly. But if you're looking for a steady, versatile tool that will inform you about events of your network and won't blow your budget, the free monitoring application Nagios may be the answer.
According to the Nagios website, the purpose of Nagios is to "...inform you of network problems before your clients, end users, or managers do." Nagios monitors the hosts on your network, checking for symptoms of possible problems. You can use Nagios to monitor network services, host resources (such as processor load and available disk space), and environmental factors such as the temperature in the server room.
Nagios is easily extensible - you can get Nagios to monitor almost any potential network problem. You can display Nagios output in a graph or an HTML-based table. You can even get Nagios to send you an alert if a problem appears.
Nagios is not exactly a complete monitoring solution, but is more like a daemon that manages the monitoring process. The Nagios configuration defines the hosts and services that Nagios will monitor, and small, independent test programs known as plugins obtain and return the status information. Several predefined plugins are available through the Nagios website, and you can also create your own plugins.
The hosts and services monitored by Nagios are all defined through the Nagios configuration files. The configuration files also contain settings for the Nagios daemon itself, as well as information on the contacts who will receive warnings from Nagios alerts.
At this writing, the current, stable session of Nagios is version 2.7. For a small- to medium-sized network, you're better off working with the stable version. To monitor a very large network with 300 to 400 hosts, you may wish to experiment with the upcoming version 3.0, which promises genuine performance benefits, especially in larger environments.
You can download Nagios from the project website [1], however, many Linux distributions include a version of Nagios. Packages for Debian [2], Fedora, Red Hat, or RedHat Enterprise [3] are available, and you can obtain SUSE packages from the popular FTP mirrors. Many Nagios users find it easier to build Nagios from source code, as this gives you the ability to install security patches more quickly.
To build Nagios yourself, you will need to install the apache or apache2, libgd, libjpeg-devel, and openssl-devel packages, including any dependencies. The following commands prepare the server for installing Nagios:
useradd nagios
groupadd nagios
mkdir /usr/local/nagios
chown nagios:nagios /usr/local/nagios
useradd nagcmd
groupmod -A nagcmd www-data
groupmod -A nagcmd nagios
The next step in is to unpack and install the source code:
tar zxvf nagios-2.7.tar.gz
cd nagios-2.7
./configure --with-command-group=www-data
make all
./configure -help gives you an overview of the parameters that are available for the build. After completing the build, you can install the application by typing make install. Additional make commands install an init script, a sample configuration, and a pipe for communication between the web interfaces and the daemon:
make install-init
make install-config
make install-commandmode
The Nagios package itself does not contain any plugins, and you will need to install them separately.
You can obtain the plugins from the Nagios website [1]. Version 1.4.6 of the plugins is the current version. However, many plugins will not build unless you have specific header files or clients libraries installed on your system. Additionally, some plugins are only available as Perl scripts or are located in the contrib subdirectory of the plugin package. You will need to copy plugins of this kind to /usr/local/nagios/libexec.
The central Nagios configuration file, /usr/local/nagios/etc/nagios.conf, contains global settings for the Nagios daemon. A sample configuration file is generated automatically when you compile the Nagios binaries. If you are using a package-based Nagios version, or if you are working with a version of Nagios preinstalled on your system, look for a sample configuration file in the Nagios directories. (See "Managing Configuration Files" for more on sample files in Nagios.) The Nagios configuration file contains more configuration options than this article can cover. Complete documentation of the Nagios configuration file is available at the Nagios website [4].
One of the most important settings in this global configuration file is a reference to the object definition file(s) that will be used with Nagios:
cfg_file = <filename>
The object definition file contains most of the site-specific information describing the hosts and services you wish to monitor. Depending on the size and complexity of your network, you may wish to place this object information in several files.
You can either use the preceding cfg_file directive multiple times, or you can use the cfg_dir directive to specify a directory with object definition files:
cfg_dir = <directory name>
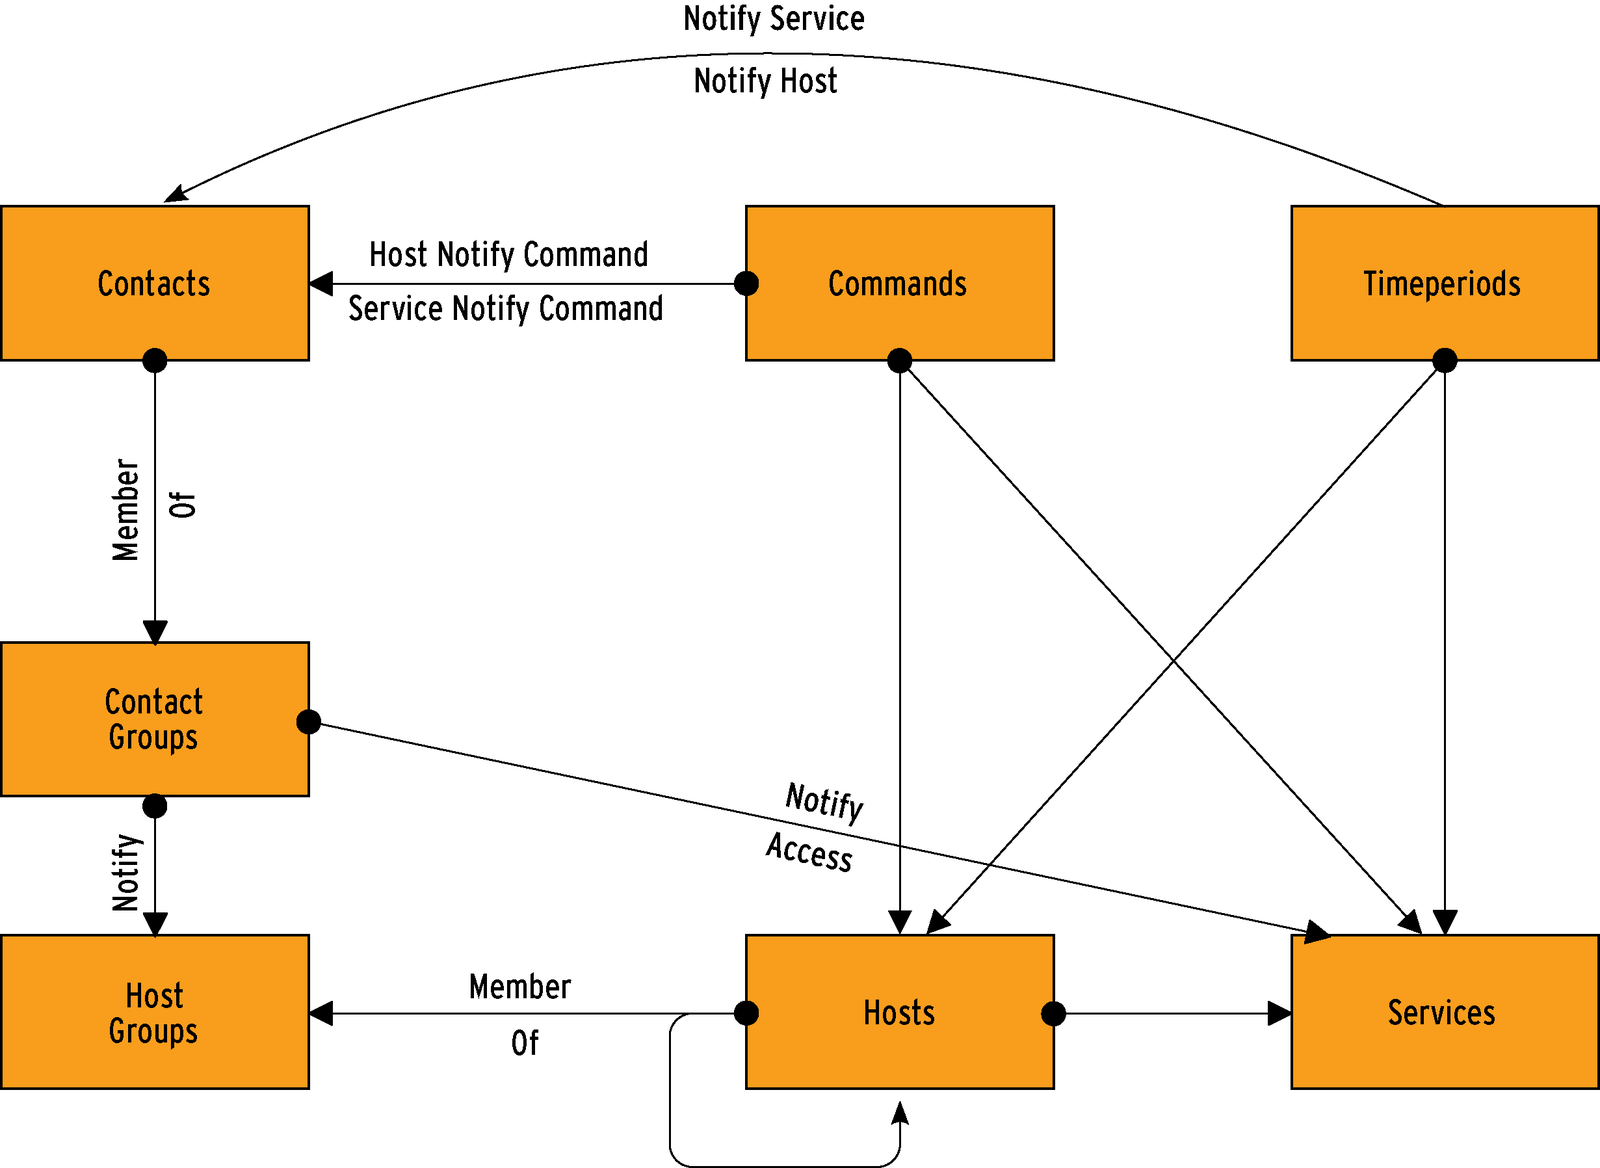
A Nagios object is essentially anything that Nagios needs to know about, such as a service you wish to monitor, a command to call an external program, a host operating on the network, or a contact who will receive notification in case of emergency.
The box called "Nagios Objects" lists some of the possible objects in the object definition file. The Nagios website provides a complete description of pre-defined Nagios objects [5]. I'll describe a few of the most important objects.
Timeperiod settings define when to monitor or notify. The Timeperiod object spells out the time period information (see Listing 1).
| Listing 1: Timeperiod Configuration |
01 define  timeperiod {
02         timeperiod_name         nonworkhours
03         alias                   outside working hours
04         monday                  00:00-09:00,17:00-24:00
05         tuesday                 00:00-09:00,17:00-24:00
06         wednesday               00:00-09:00,17:00-24:00
07         thursday                00:00-09:00,17:00-24:00
08         friday                  00:00-09:00,17:00-24:00
09         saturday                00:00-24:00
10         sunday                  00:00-24:00
11 }
|
The most important property associated with the Timeperiod is timeperiod_name, which is referenced by many other functions in the Nagios configuration. The web interface uses the extended alias name. Individual time values always refer to a weekday.
It is preferable to use a separate configuration file for time periods, such as /usr/local/nagios/etc/objects/timeperiods.cfg. Initially, you will need three definitions of the most common scenarios, for example, for always, workhours, and nonworkhours.
Nagios refers to any kind of combined definition that calls a program or shell script as a command. An example is shown in Listing 2. In this example, the command object tells Nagios to call the check_smtp plugin with specific parameters. $HOSTADDRESS$ refers to a Nagios macro to which appropriate data is passed when the macro is called. The plugin parameter -p stands for the SMTP port number, and -w and -c introduce the WARNING and CRITICAL thresholds.
| Listing 2: Defining a Command |
01 define  command {
02         command_name    check_smtp
03         command_line    $USER1$/check_smtp -H         $HOSTADDRESS$ -p $ARG1$ -w $ARG2$
04         -c $ARG3$
05         }
|
The information passed to the plugin depends on the plugin you are using. HTTP monitoring requires parameters such as the server name, the path, the user name and the password, whereas a ping check just requires an IP address. The easiest way to find out which parameters a Nagios plugin needs is to run the plugin with the --help parameter.
Nagios defines persons and contact addresses with the Contacts object (see Listing 3). Contacts are mainly used for notification in case of problems, but they are also used to assign access privileges to the web interface.
| Listing 3: Contacts in Nagios |
01 define  contact {
02         contact_name                    jdoe
03         alias                           Jon Doe
04         service_notification_period     nonworkhours
05         host_notification_period        nonworkhours
06         service_notification_options    w,u,c,r
07         host_notification_options       d,u,r
08         service_notification_commands   notify-by-email
09         host_notification_commands      host-notify-by-email
10         email                           jdoe@example.com
11 }
|
Listing 3 is the first example of an object defined with another object: for example, nonworkhours is defined in the Timeperiods object (see Listing 1). notify-by-email and host-notify-by-email represent commands that Nagios uses to pass on messages.
To avoid the need to list large numbers of individual contacts, you can add the contacts to groups:
define contactgroup {
 contactgroup_name linux-admins
 alias    Linux administrators
 members  jdoe,mtestmann,wadmin
}
Any device you wish to monitor must be defined as a host (Listing 4).
| Listing 4: Host Definition |
01 define  host {
02         host_name                       linux1
03         alias                           Linux Server 1
04         address                         192.168.1.254
05         parents                         main-switch
06         check_command                   check-host-alive
07         max_check_attempts              5
08         check_period                    always
09         contact_groups                  linux-admins
10         notification_interval           30
11         notification_period             always
12         notification_options            d,u,r
13 }
|
The most important properties of a host are its name and IP address. The max_check_attempts variable defines how often to repeat a check before Nagios assumes a failure and notifies an administrator. contact_groups specifies groups to notify in the case of a failure. Our example uses a contact group that we set up earlier. Individual hosts can be collected in arbitrary host groups for easier management:
define hostgroup {
 hostgroup_name linux-servers
 alias    Linux Server
 members  linux1,linux2,tux,webserver,mybox
}
Once you have defined time, host, and contact settings, you're ready for the service definitions. A service definition specifies the resources you wish to monitor. This is where everything we have specified starts to gel (Listing 5).
| Listing 5: Service Check Configuration |
01 define  service {
02         service_description     smtp check
03         host_name               linux1
04         check_command           check_smtp!25!10!20
05         max_check_attempts      3
06         normal_check_interval   5
07         retry_check_interval    1
08         check_period            always
09         notification_interval   30
10         notification_period     always
11         notification_options    w,c,r
12         contact_groups          linux-admins
13         }
|
Listing 5 also demonstrates how to pass parameters to a check command. Note that the parameters are separated by !. This passes the values in to the macros $ARG1$, $ARG2$ and so on, which are then passed on to the plugin.
In normal operations, it makes sense to distribute the Nagios configuration over multiple, individual files and, depending on your project requirements, to organize the files in various subdirectories. For the time being, you can probably make do with a single file. The Nagios sources include a file called localhost.cfg or minimal.cfg, which is perfect for your first steps with Nagios.
After creating or modifying the Nagios configuration files, you can perform a configuration check. The -v switch tells Nagios to check the complete configuration for syntax errors and, above all, to make sure that references to other objects can be resolved correctly. As an argument, Nagios just expects the name of the main configuration file:
/usr/local/nagios/bin/nagios -v /usr/local/nagios/etc/nagios.cfg
If successful, the configuration check displays a message: Things look okay. No serious problems were detected during the pre-flight check.
| Nagios Objects |
|
Nagios needs at least one configuration entry for the following objects.
The following objects are not strictly necessary, but they are offered as extended configuration options:
|
You can launch the daemon by entering the following command: /etc/init.d/nagios start. If the daemon is already running, you can just tell it to reload to parse the new configuration: /etc/init.d/nagios reload.
Assuming that Nagios does not output any error messages, you have now started the daemon, which will monitor the hosts and services you have configured. To find out which steps Nagios is currently performing, you can take a close look at the Nagios logfile: tail -f /usr/local/nagios/var/nagios.log.
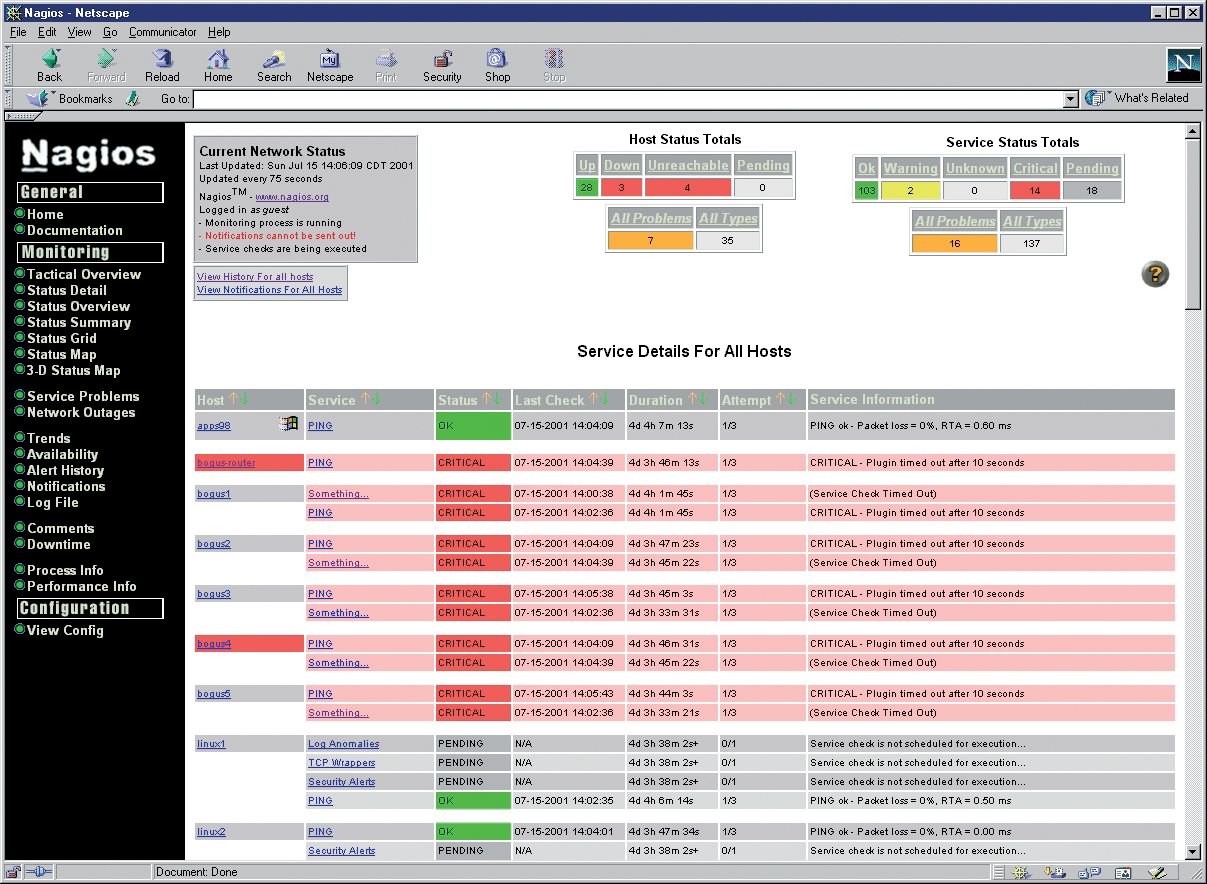
For normal controls, and above all, to check the current status of all servers you are monitoring, Nagios comes with an integrated web interface that you need to integrate with your local Apache installation. If you are running Apache2, the best approach is to create a file called /etc/apache2/conf.d/nagios with the entries shown in Listing 6.
To allow users to log on to the Nagios web interface, you need to define account entries in htpasswd.users. If this file does not exist, you will need to create it using htpasswd:
touch /usr/local/nagios/etc/htpasswd.users
htpasswd /usr/local/nagios/etc/htpasswd.users jdoe
The user names must match the Nagios contacts you created previously to allow the web interface to identify the correct users and show these users only the hosts you assign to them. The cgi.cfg file handles other web interface functions and privilege settings.
| Listing 6: Nagios Web Interface Configuration |
01 ScriptAlias /nagios/cgi-bin /usr/local/nagios/sbin 02 03 <Directory "/usr/local/nagios/sbin"> 04 Options ExecCGI 05 AllowOverride None 06 Order allow,deny 07 Allow from all 08 AuthName "Nagios Access" 09 AuthType Basic 10 AuthUserFile /usr/local/nagios/etc/htpasswd.users 11 Require valid-user 12 </Directory> 13 14 Alias /nagios /usr/local/nagios/share 15 16 <Directory "/usr/local/nagios/share"> 17 Options None 18 AllowOverride None 19 Order allow,deny 20 Allow from all 21 AuthName "Nagios Access" 22 AuthType Basic 23 AuthUserFile /usr/local/nagios/etc/htpasswd.users 24 Require valid-user 25 </Directory> |
A Nagios plugin is essentially a small utility that obtains system information. As mentioned previously, a collection of plugins is available for download at the Nagios website. At a SourceForge site devoted to the development of new plugins [6], you'll find links to third-party plugins and information on writing your own plugins.
Because plugins are independent programs, you can simply run a plugin at the command line to test it. It makes sense to work with the Nagios server's user account, as this is the account that will run the plugins when you go live. The command line will differ for each plugin, as every check type may require different parameters. This said, every plugin should have -h or --help implemented. Calling help gives you a quick summary of the various options.
Consider the check_disk plugin:
nagios# ./check_disk -w 50% -c 20% -p /$$

DISK OK - free space: / 45256 MB (64% inode=98%);| /=25137MB;37080;59328;0;74160
Plugins provide a return code value that is not directly visible by default. You can display the return code by typing echo $?. The numeric return codes stand for the following results: 0 for OK; 1 for WARNING; 2 for CRITICAL; and 3 for UNKNOWN.
The second part of the plugin output is the visible results displayed in the web interface. Many plugins translate the return value into a clear message, such as the DISK OK message the above output shows. However, you should not rely on this - if in doubt, check the return code.
The third part of the results is separated from the rest by a pipe symbol, |. Nagios refers to this section as the performance data. Add-ons process these values, converting them to charts or graphs that show changes.
If Nagios fails to find the plugin, or if the plugin isn't executable, or if the plugin does not return the correct response to the daemon, the web interface displays a status of UNKNOWN and an error message of Return Code of 127 is out of bounds.
The parameters listed previously, -w and -c, are defined for most plugins, as they also define the thresholds for WARNING and CRITICAL. Our example sets the threshold for the remaining free space on a partition to 50 or 20 percent. When testing a plugin at the command line, you need to choose a very low threshold just to see if the plugin really does return the required status.
If the results of your preparation and checks are to your liking, you can add an entry for the plugin as a check command in your Nagios configuration:
define command {
command_name check_disk
command_line $USER1$/check_disk -w $ARG1$ -c $ARG2$ -p $ARG3$
}
It is not typical to hard code warning thresholds and partition names; instead you would normally specify these values when you define the service.
To retain as much flexibility as possible, Nagios uses macros. Macros are strings whose names start with a $ sign; the string is replaced with data at program runtime. $ARGx$ macros are more important. They are used to store parameters from service definitions.
When monitoring remote resources, Nagios distinguishes between direct and indirect checks. Direct checks are launched locally on the Nagios server. Almost all checks that relate to network protocols, such as ping, DNS, SMTP, or HTTP, are run as direct checks that simulate access just like a normal client:
nagios# ./check_http -H linux-magazin.de -w 5 -c 10
HTTP OK HTTP/1.1 200 OK - 78673 bytes in 0.366 seconds
Nagios uses indirect checks if the plugin needs to request local data from a remote host.
To do so, Nagios has to connect to the host before running the plugin directly on that host. The simplest way of achieving this is to set up SSH connections between the Nagios server and the clients without assigning passwords and to use SSH to call the plugins. The Nagios plugin package provides a check_by_ssh plugin for this purpose.
To launch the check_disk plugin remotely on another server, you need to encapsulate it in check_by_ssh. The command definition looks like this:
define command {
   command_name check_ssh_disk
   command_line $USER1$/check_by_ssh -t 60 -H $HOSTADDRESS$ -C "$USER2$/check_disk -w $ARG1$ -c $ARG2$ -p $ARG3$"
check_by_ssh is launched locally. It establishes a connection to the server and then runs the check_disk plugin, which is installed on the server. The path to plugins on remote servers is stored in the $USER2$ variable, so there is no need to specify the path.
Another option is the Nagios Remote Plugin Executor (NRPE), a Nagios client-server program for launching remote plugins. To use Nagios Remote Plugin Executor, you need to install the NRPE Server along with the plugins on the servers you are monitoring. NRPE comprises a daemon for the Nagios clients and a check plugin for the Nagios server.
It makes sense to compile the plugin directly on the Nagios server. After unpacking, simply type ./configure and make all. This creates check_nrpe, which you can then copy to the required local directory with the other plugins before going on to configure a matching check command:
define command{
   command_name check_nrpe
   command_line $USER1$/check_nrpe -H
   $HOSTADDRESS$ -c $ARG1$
}
To save work, you can install the Nagios Remote Plugin Executor service on the clients from the packages or copy it from the Nagios server.
It makes sense to run NRPE under inetd or xinetd and to use TCP wrapper. The README file for the NRPE package contains instructions.
Finally, you need to enter the checks you want NRPE to run remotely in nrpe.cfg (see Listing 7). The sample file has a couple of examples (see Listing 6).
Although NRPE is the official tool for remote checks, it has some disadvantages in comparison to SSH; for example, Nagios Remote Plugin Executor needs an additional daemon, and you need to open up yet another port.
| Listing 7: NRPE Examples |
01 command[check_users]=@libexecdir@/check_users -w 5 -c 10 02 command[check_load]=@libexecdir@/check_load -w 15,10,5 -c 30,25,20 03 command[check_disk1]=@libexecdir@/check_disk -w 20 -c 10 -p /dev/hda1 04 command[check_disk2]=@libexecdir@/check_disk -w 20 -c 10 -p /dev/hdb1 |
SNMP is the tool of choice for collecting information on remote hardware. The Nagios plugin package provides check_snmp for this purpose.
You can use check_snmp to acquire values via the OID of the vendor MIB. Following the familiar pattern for other Nagios plugins, the command line for this is: nagios# ./check_snmp -H <ip_address> -o <OID> -w warning -c critical -m :.
The last argument, -m :, is important but not very well documented. The -m : parameter prevents the plugin from attempting to load locally installed MIBs. This causes error messages with all the plugin versions. However, you do need to find the right OIDs yourself, either by checking out the vendor MIBs or by trial and error using snmpwalk.
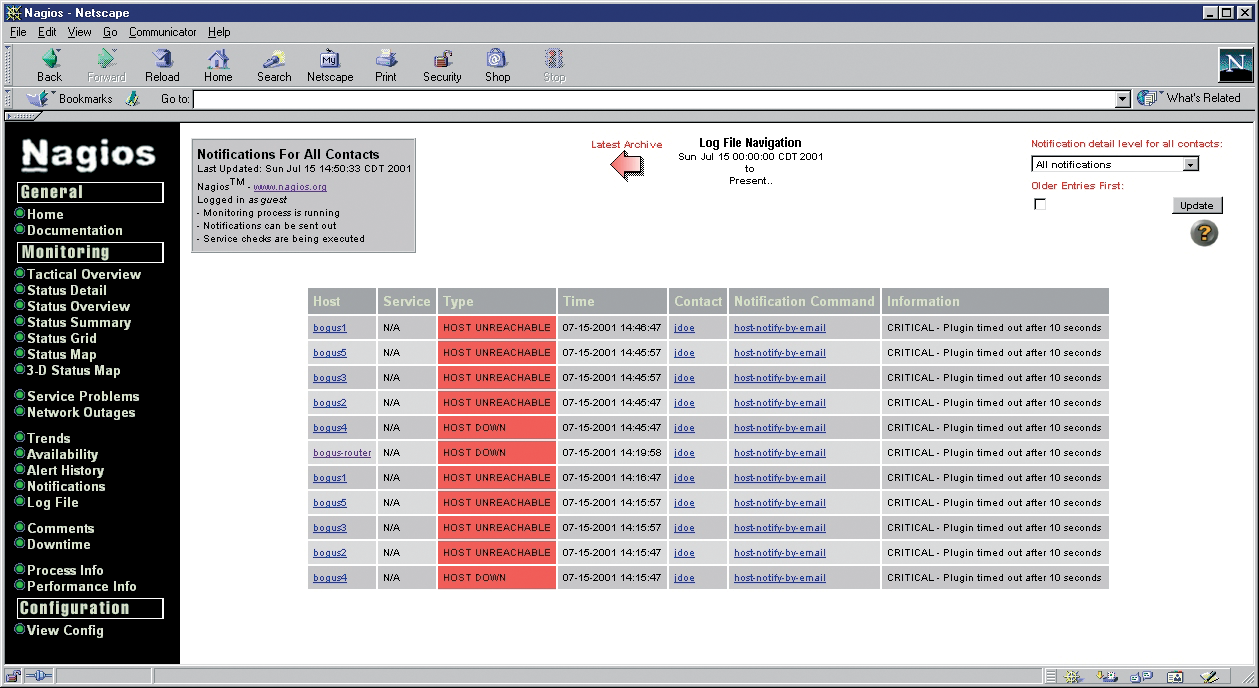
All of this network monitoring is of very little use unless you notify the administrator in case of problems. Again, Nagios has a collection of sophisticated alert functions. Each time Nagios detects an error somewhere in the system, it starts a complex analysis process. The software starts by checking whether anyone has acknowledged the error (see max_check_attempts), whether downtime for the host or service has been entered via the web interface, and whether the alert is enabled for the current time of day (see notification_intervall).
After doing this, Nagios discovers the contacts assigned to the host and checks its notification settings to find out if the contacts should be notified, and if so, what kind of notifications they expect (see notification_options).
Finally, Nagios checks whether the contact wants to be alerted at the current time (see notification_period). Thanks to this schema, Nagios supports very granular control of notifications.
Depending on the host, time, and contact, you can send different messages by different channels. To focus this mechanism even further, escalations give administrators the ability to change the way subsequent alerts for existing programs are handled.
To actually send out an alert, Nagios sends a command similar to the check commands. In other words, notifications are not hard-coded in Nagios. Instead, the program runs a shell command or script (Listing 8).
The important part of the alert configuration is the data sent to the mail program. Again, macros are used to pass on the data. The Nagios documentation includes a full list of available macros.
| Listing 8: Notification Configuration |
01 define  command {
02         command_name notify-by-email
03         command_line /usr/bin/printf "%b" $$
04         "***** Nagios 1.0 *****\n\n $$
05         Notification Type: $NOTIFICATIONTYPE$\n\n $$
06         Service: $SERVICEDESC$\n $$
07         Host: $HOSTALIAS$\n $$
08         Address: $HOSTADDRESS$\n $$
09         State: $SERVICESTATE$\n\n $$
10         Date/Time: $DATETIME$\n\n $$
11         Additional Info:\n\n $$
12         $OUTPUT$" | /usr/bin/mail -s $$
13         "** $NOTIFICATIONTYPE$ alert - $HOSTALIAS$/$SERVICEDESC$ $$
14         is $SERVICESTATE$ **" $CONTACTEMAIL$
15 }
|
As a starting point for your experiments, Nagios includes a number of sample files. The minimal.cfg file simply implements a couple of checks for localhost. bigger.cfg has a few more sophisticated examples. However, even if you only need to monitor a small network, it makes sense to put more effort into organizing your object configuration.
Distributing the objects over separate files based on object type is recommended (i.e., use a dedicated hosts.cfg, services.cfg, contacts.cfg, and so on), but even this approach quickly becomes hard to keep track of, and there is no real reason to keep individual object types separate.
Nagios will find the objects no matter how many different files or even directories you spread them over, as long as your nagios.cfg file points to the right places.
It makes sense to use subdirectories to structure your configuration logically. For example, you could store global settings and your network sites at the top level. The next level would then contain individual subdirectories for each customer, department, or device type.
You can then include related objects, such as a host along with the services and contacts assigned to it, in the same configuration file. The best approach is to organize objects in a way that helps you find them easily.
| Monitoring Windows Servers with Nagios |
|
Of course, Nagios offers several solutions for monitoring Windows servers. Besides NRPE, of which a Windows version is also available, NsClient is a Windows agent that is simple to use. The name NsClient refers to the name of NetSaint, which was Nagios's name up to about 2001. And NsClient++ is a successor that combines the functionality of both alternatives in a single agent. The installation is extremely simple: after unpacking the ZIP file, you simply copy the files to a suitable location on the Windows server, such as c:\Programme\NsClient++, and modify the settings in NSC.ini to reflect local requirements. In particular, you need to enable the individual modules at the start of the configuration file. After that, the Windows administrator needs to install the Windows service via Start | Run by entering c:\Programme\NSClient++ /install and net start nsclient++. As the agent contains both of its predecessors, you can use both plugins on the Nagios server, that is, check_nt or check_nrpe. The former has values for the CLIENTVERSION, CPULOAD, UPTIME, MEM-USE, USEDDISKSPACE, SERVICE-STATE, and PROCSTATE parameters and for all Windows PerfMon counters. A call to query the status of a Windows service looks like this: ./check_nt -H <host_address> -p <port> -s <password> -v SERVICESTATE -l <dienstname> The easiest way to discover the name of the querying Windows services is via the Windows service manager properties, which is in Start | Administration | Services. While most other parameters are self-explanatory, performance counters need some explanation. The Windows performance monitor is a central interface for performance values. Administrators can use it both to query Windows internal performance data and data from many other server applications, such as Exchange Server or SQL Server. The syntax for doing this is #./check_nt -H <host_address> -p <port> -v COUNTER -l "\\Performanceobject(Instance)\\Indikator" The return value can be reformatted for plugin output. |
Nagios offers far more than I could hope to describe in this article. Innumerable add-ons and additional projects give administrators the ability to add monitoring functions for any plausible scenario. Nagios also supports alternative notification systems that use SMS and even make phone calls (Figure 4). The add-on portal [3] is the best place to go if you are looking for a Nagios extension or plugin.

No matter how unusual your needs are, you are bound to find an appropriate plugin, or at least a plugin you can use as a starting point for creating your own custom solution. Don't forget to share your new plugin with the community.
| INFO |
|
[1] Nagios homepage: http://www.nagios.org
[2] Debian repository with Nagios packages: http://www.backports.org [3] Plugins and Add Ons: http://www.nagiosexchange.org [4] Nagios configuration file documentation: http://nagios.sourceforge.net/docs/2_0/configmain.html [5] Nagios Objects: http://nagios.sourceforge.net/docs/2_0/xodtemplate.html [6] Nagios Plugins: http://nagiosplug.sourceforge.net/ |
| THE AUTHOR |
|
Julian Hein is the founder and CEO of NETWAYS GmbH (http://www.netways.de), which has been in the business of implementing the launching of and operating complex networks for more than 10 years. |