
By Peter Kreußel
Linux supports many sophisticated server monitoring tools that analyze a server's health state, log the results, and print colorful graphs and reports. But if you are just interested in finding out why the hard disk LED on your desktop is flashing wildly, what you really need is a simple, at-a-glance overview of the system status. A quick look at the system status will show you which applications are hogging memory or which processes are hogging the CPU.
The KDE and Gnome desktop environments each have on-board tools for this task: Ctrl+Esc on KDE launches the KDE system monitor, KSysguard. Gnome has the Gnome System Monitor for the same task. The KDE application, in particular, requires a significant amount of system resources. Because users typically need a monitor to find out why a machine is overloaded, this seriously affects the tool's usability.
Toggling to the command line and launching Top in a heavy-load situation typically returns quick results. On the downside, the legacy Top tool is not exactly renowned for its usability. The process list in Top just gives you as many entries as the console will let you view. It doesn't have to be this way, as the Htop command-line tool demonstrates. Htop, which aims to be an "enhanced Top," underlines its claim by scrolling the process list like a GUI application. Because Htop is still a command-line program, it can be remotely controlled via slow network connections, unlike some of the GUI alternatives. Another command-line alternative is Atop, which also adds some interesting features not found in Top.
We decided to investigate which of these quick system status tools is best for giving users a fast but detailed overview of a system's health.
For decades, systems administrators have turned to Top to provide a quick overview of the system. Of course, a legacy tool like this is not a shining example of usability: You probably know the feeling of waiting for seconds while Top displays an error message just because you inadvertently pressed a key without a shortcut assignment. If you can't remember all the keyboard shortcuts in this command-oriented (but not menu-oriented) program, you could find yourself making too many calls to the Help page (Figure 1).
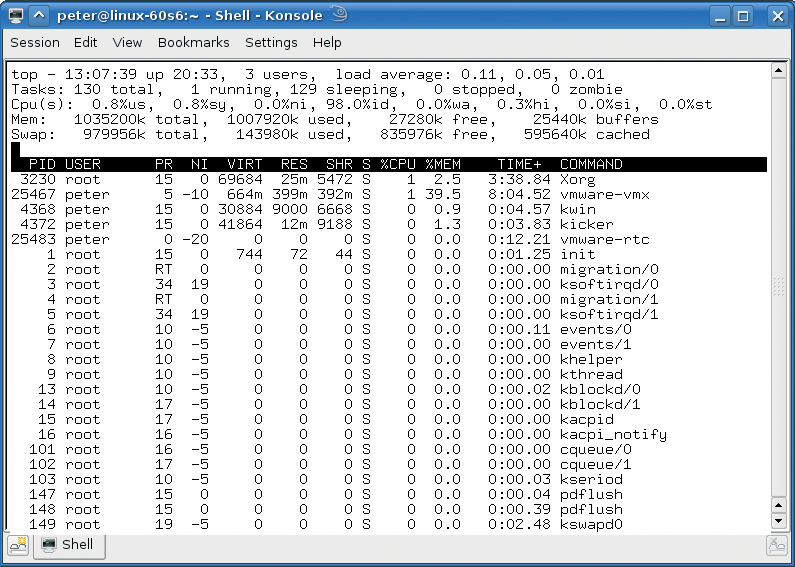
Top is still very popular, probably because it is installed on almost every Linux system and, despite its shortcomings, does indeed provide a comprehensive view of the system load status. No system monitor, whether GUI or command-line based, should be without the functions Top offers.
Top groups the process load into load generated by userspace programs and kernel load. The display shows you the CPU resources consumed by the process at the cost of programs with lower priority. Top output also shows the time spent waiting for the I/O subsystem (wa) or for hardware and software interrupts (hi and si). At the process level, Top [1] displays useful values, such as the CPU time and storage consumption, and lower level technical information, such as the page fault count or the amount of stack memory that some applications fail to release when the user closes documents or dialog boxes.
The Top display does not need to be as spartan: The software supports colored output for a better overview, and it can split the process list up into four areas, sorted by different criteria (Figure 2). W writes a configuration file to your home directory, thus making the settings pervasive on relaunching the program. You can change the criteria that Top uses to sort the process list, as well as the column order, and you can specify which values Top should display for the individual processes, but that more or less concludes the customization options.
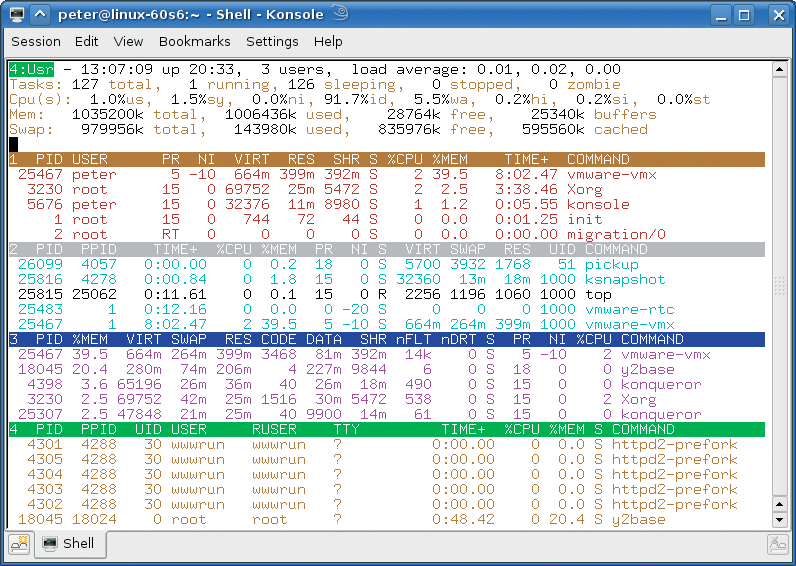
It makes sense to kill frozen processes directly in system monitoring applications or to reduce the priority level of CPU hogs. Top implements this functionality. You cannot select the process you want to kill directly in the list, strangely, you type the process ID instead.
Intuitive, menu-based controls were the developers' goals for the command-line Htop [2] system monitor. And the word in sysop forums is that Htop delivers, which explains why many administrators are moving from Top to Htop.
One of Htop's characteristic features is that it does not simply truncate the process list when it runs out of display space. When you move the cursor down to the lower edge of the screen, Htop scrolls the process overview. The left arrow and right arrow keys move the display laterally, giving Htop the ability to display an arbitrary number of columns and removing the need to truncate longer command lines (Figure 3).
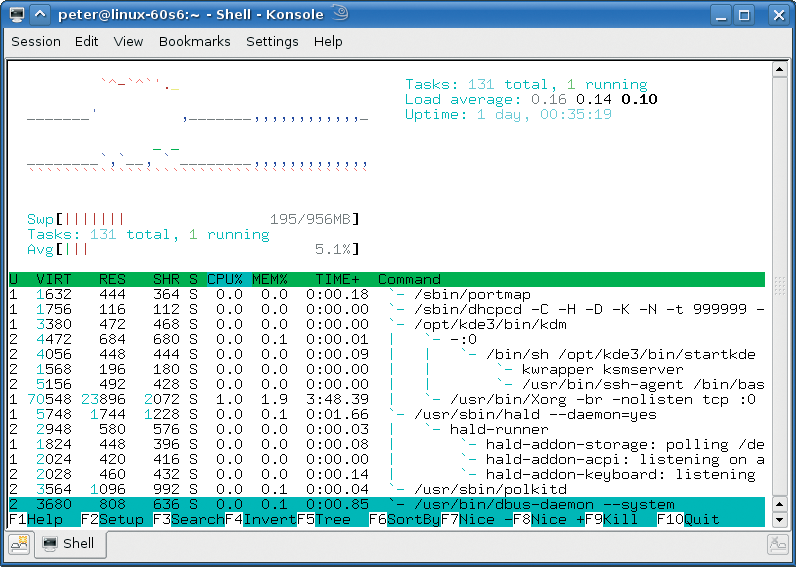
Htop has a search function that facilitates the task of searching for processes in a long list. The tree view indicates process dependencies to the best of the console's ability with block graphics (Figure 3). Htop is easy on the user's nerves too: If you inadvertently press a key without an assignment, Htop does not bother issuing a warning. Users who do not use the application regularly will appreciate the menu-based configuration. The menu takes users to options for splitting the CPU load into its I/O wait state, software interrupt, and hardware interrupt components. The acronyms the configuration menu uses to denote the values shown in the process list are a barrier to users who are unfamiliar with kernel internals.
To change the priority of the process or halt the process, you can select a process in the overview and press a key. Users can select Unix signals for process manipulation from a list. Entering s starts strace for the active process. If the GPM is running on the console, you can even use your mouse to control Htop.
Htop displays values for global statistics either as figures, a bar graph, or a line graph. The graph might not be very pretty because it uses block graphics, but it does give you a useful overview of the changes in the last minute. Htop uses colors much like a GUI-based program to separate the current values from mean values acquired over a longer period of time.
Htop's analytic performance is much on par with Top, and it measures the same values globally, as well as for individual tasks. The configuration menu promises that Htop can show the launch time for a process; if an application freezes, it is interesting to know how long it will run before it crashes. Top does not give you this information. Unfortunately, the column remained blank in the task list on OpenSUSE 10.2, although the Gnome System Monitor displayed the value on the same system.
All told, Htop lives up to its aim to be "a better Top": It analyzes the system just as well as Top, and it gives users improved usability and a better overview.
Like Htop, Atop aims to provide a Top alternative. The command-line program focuses on slightly different points: Whereas Htop attempts to facilitate control, Atop concentrates on enhancing the feature scope. The first example of this is that Atop measures resource consumption by individual processes more precisely than many other system monitors. If a process stops within a measuring period, the process will still be displayed in the process with its share of resource consumption. Atop's default value of 10 seconds for a measurement thus does not lead to inconsistencies between the global statistics and the sum of all values in the process list.
Atop also acquires more values for global statistics than other system monitors: Besides the process load, the software also measures the number of context switches and interrupts. The memory statistic shows not only memory usage by application, the disk cache, and the filesystem buffer, but also the percentage of kernel mallocs. Atop adds values for committed memory and maximum memory available for commits to the swap space statistics; as you may be aware, optimistic memory management on Linux can lead to values that exceed the sum total of physical memory and swap space.
Atop distinguishes between drives in its disk statistic. The busy column shows percentage of the measuring period in which the drive was busy. Besides the read and write access counts, Atop also measures the average access time for read and write access. This value is a combination of the hard disk latency, the duration of the search by the disk head, and data transfer time. This gives administrators a useful overview of components causing bottlenecks as well as a chance to see hard disk failures coming.
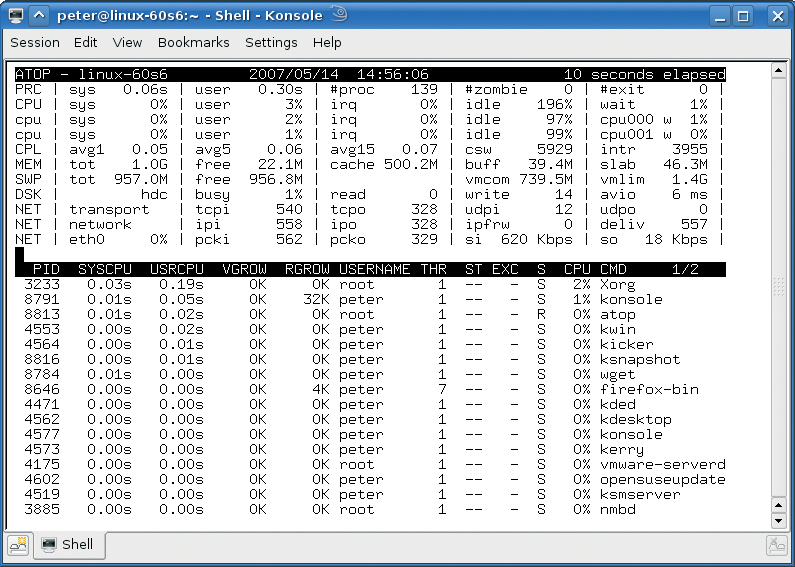
Atop is the only system monitor in this round-up to show the I/O load and network traffic at process level (Figure 4). This assumes you have a patched kernel, however. Patches are currently available on the Atop homepage [4] for kernel versions up to 2.6.21. For these metrics, you need to launch the application with root privileges. It will probably not be worth your while patching and rebuilding the kernel just to run a system monitor, unless you are putting together a test system for software evaluation before production use; in this case, Atop can give you some useful information. Atop will run on unpatched systems, but it will not give you network load and disk I/O information at the process level.
The definitive feature of KSysguard [5] is its configurability; users can use the sensor browser to display global acquired values for the required sensors hierarchically in a tree structure and use the mouse to drag them to an empty spot in the workspace (Figure 5). KSysguard assigns a tab at the top of the window to each workspace so that the application can display numerous sensor values at the same time without sacrificing readability. KSysguard visualizes the values as figures, bar graphs, or line graphs. Instead of displaying values, the software can also write the values to a file. A graph can visualize multiple values at the same time, and you can customize the colors in this case.
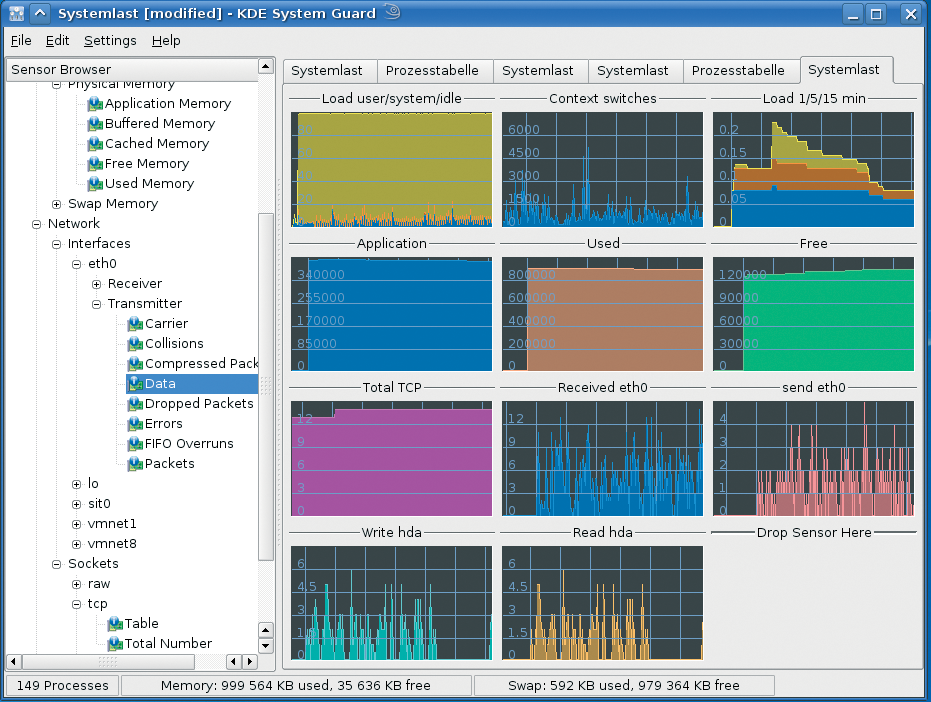
In recent versions, there is a search box above the process overview. When you type an entry, the tool leaves entries that contain your search key in the process table. If you select one or more processes in the list, you can right-click to issue a Unix signal to kill the processes or modify their priorities. Right-clicking also lets users display or hide columns with acquired values, and there is an option for hiding other users' processes.
The CPU and I/O load values that KSysguard gives you are what you would expect from Top, apart from the I/O wait component. Apart from CPUs and hard disks, the software also monitors network traffic and differentiates between network adapters and protocols.
The KSysguard daemon compensates for the disadvantage of X Window applications (that they require a fast network connection for remote use) with the use of a local KSysguard instance to start an instance on a remote machine. On KDE-based systems, administrators can assume that the daemon is installed because it is part of the KDE basic package. In combination with the configurable tabbed display and the ability to log the data it visualizes, KSysguard comes close to being a full-fledged monitoring solution. However, this feature scope makes KSysguard a slow starter on systems under heavy load.
If you assume that KDE components place more emphasis on feature scope and that Gnome programs focus on usability at the cost of some features, you could find your assumptions partly confirmed in this comparison of the KDE and Gnome system monitors: The global resource statistics show an unqualified CPU load value; the virtual memory usage, including the percentage swapped out; and the volume of network traffic for all adapters. Users can configure the colors and the update interval.
But assessing the Gnome System Monitor purely on the basis of the system resource statistics would be a mistake because it ignores the fact that the process list shows more values than its KDE counterpart (Figure 6); users can determine X Server resources consumed by an application with the Gnome System Monitor. Many applications, such as web browsers and image viewers, store the bitmaps they display as X Resources. The problem with this is that the applications often "forget" to release resources they no longer need, and this can cause the X Server's memory usage to skyrocket. The standalone application Xrestop is at Freedesktop.org [6], but the Gnome System Monitor will save you the trouble of building it.
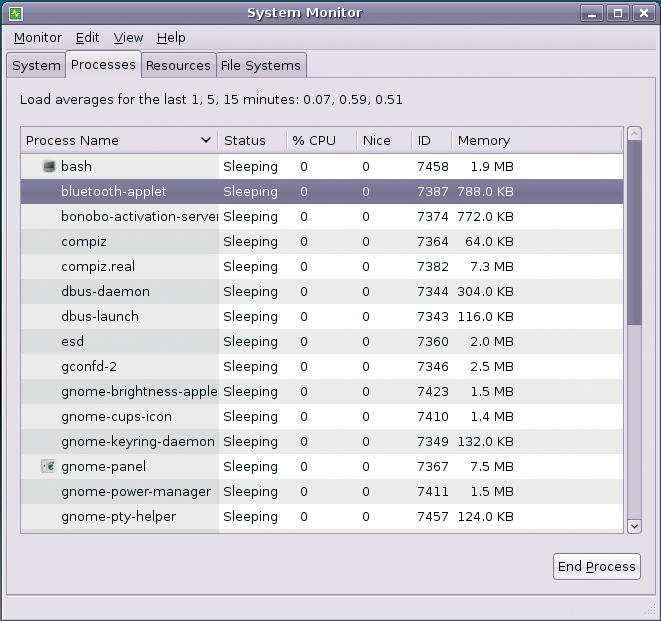
Another feature, which is offered only by the Gnome System Monitor of all the test candidates discussed here, is the ability to display the SELinux context of a process. Right-clicking Memory cells exposes the shared libraries, including their positions in virtual memory. The ability to display the files a process is accessing is also useful.
Compared with the KDE system monitor, the Gnome process list lacks a search function, but to compensate for this, users can hide arbitrary processes. The hidden processes item shows which programs the Gnome System Monitor ignores by default, but users can display them individually as needed. Just like the other applications, the Gnome System Monitor can modify process priorities and kill processes - with the use of signals 15 and 19 only, however. Additionally, the software has a couple of menu items for halting and continuing processes, giving users who are unfamiliar with Unix signals the ability to manipulate processes.
The KDE System Monitor is almost on par with full-fledged monitoring tools with respect to its feature scope, but it launches too slowly on a system with a heavy load - which is exactly when the user needs it. The global statistics displayed by the Gnome System Monitor are insufficient for the most part, but the process list has a couple of functions that the other candidates lack: It shows the X Server memory and open files for processes. Atop extends the functionality of the legacy Top tool, and in combination with the associated kernel patches, it is suitable for software evaluation on test systems.
Htop can best be described as a Top that is easier to use. Because it is a console program that runs independently of X Window, it is usable remotely and sparing in its resource consumption. This makes Htop the tool of choice for system administrators looking for more convenient controls than the spartan Top tool can offer.
| INFO |
|
[1] Top: http://procps.sourceforge.net
[2] Htop: http://htop.sourceforge.net [3] Htop packages: http://linux01.gwdg.de/~pbleser [4] Atop: http://www.atcomputing.nl/Tools/atop [5] KSysguard documentation: http://docs.kde.org/development/en/kdebase/ksysguard/ [6] Xrestop: http://www.freedesktop.org/wiki/Software/xrestop |