
By Charly Kühnast
Displaying the network load on an interface is not difficult, and there are countless tools for visualizing the values. But which tool gives you the best graphical representation of the measured values? Hardliners would recommend grabbing the values from the /proc directory or would do something like
watch -n 10 "ifconfig eth0|grep bytes"
and work out the averages in their heads. Obviously, that would be showing off, and imagine the embarrassment if you miscalculate. Of course, you can rule out anything that requires X11 because servers don't typically have a graphical user interface. IPTraf will give you the figures you need, but it doesn't have a history feature. The same applies to Iftop [1], although it does tell you how much traffic is reaching or leaving each communications partner.
For a quick overview, my favorite tool is Nload [2]. Nload shows you the current network load for incoming and outgoing data, depending on the graph you select (Figure 1). At the same time, it gives you the average values for a configured interval. The history feature makes working with Nload a pleasure; there's no danger of missing a peak, even if you take your eyes off the screen for a moment. The -t <value> command-line parameter, with value in milliseconds, lets you set the update interval. By default, Nload will update its display twice a second. In most cases, a more relaxed setting is fine: I typically use -t 2000, an update every two seconds.
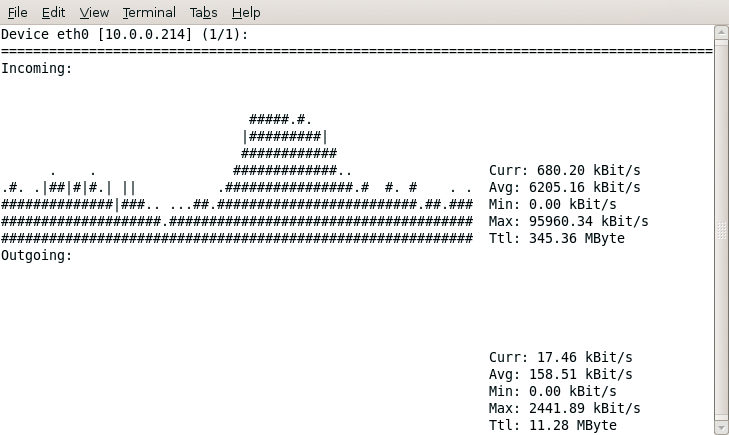
To keep the load graphs readable, you can set thresholds for incoming and outgoing traffic. If the data traffic exceeds the threshold value, Nload truncates the graph and then you know something is going wrong. The default threshold value is 10Mb/s, but you can modify this with the -i <value> parameter for incoming and the -o <value> parameter for outgoing traffic. The -s <value> parameter, with value between 1 and 9, lets you manipulate the average values. The smaller the number, the shorter the interval for which Nload calculates the averages. The highest value, 9, is the default. Another neat feature is the ability to modify critical parameters at run time - even the interface you are monitoring. Pressing O while Nload is running pops up an option menu. The changes are applied immediately.
The parameter -m is useful for servers with multiple interfaces; it tells Nload to display the load for multiple interfaces simultaneously, although you do lose the ability to draw histograms when you set this option.
| INFO |
|
[1] Iftop: http://www.ex-parrot.com/pdw/iftop/
[2] Nload: http://www.roland-riegel.de/nload/ |
| THE AUTHOR |
|
Charly Kühnast is a Unix System Manager at the data center in Moers, near Germany's famous River Rhine. His tasks include ensuring firewall security and availability and taking care of the DMZ (demilitarized zone). |