By Michael Schilli
When it comes to wealth management, the performance of a single stock in your portfolio is less important than the overall performance. Although online financial services might give you neat graphs of share price developments for individual stocks, or even a comparison of two values, they do not offer you a tool that lets you monitor the share price development of your complete portfolio at a glance. A Perl script changes this.
Figure 1 shows the configuration file (pofo1.txt) for a portfolio in a text editor. Each line starts with a date in ISO notation followed by the transaction type - a purchase (in) or a sale (out) - of an individual share, the ticker symbol, and the number of shares. The file also can handle cash transactions; instead of the ticker symbol, you see the word cash.
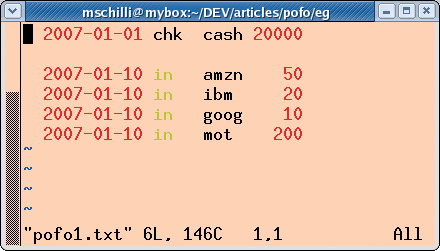
To keep portfolio management from becoming a tedious typing session, the script automatically calculates the costs and returns of share transactions at the current rate and modifies the cash balance. The program does not take charges into account, instead, it relies on the user adjusting the balance every now and then manually by using a cash entry and a chk transaction.
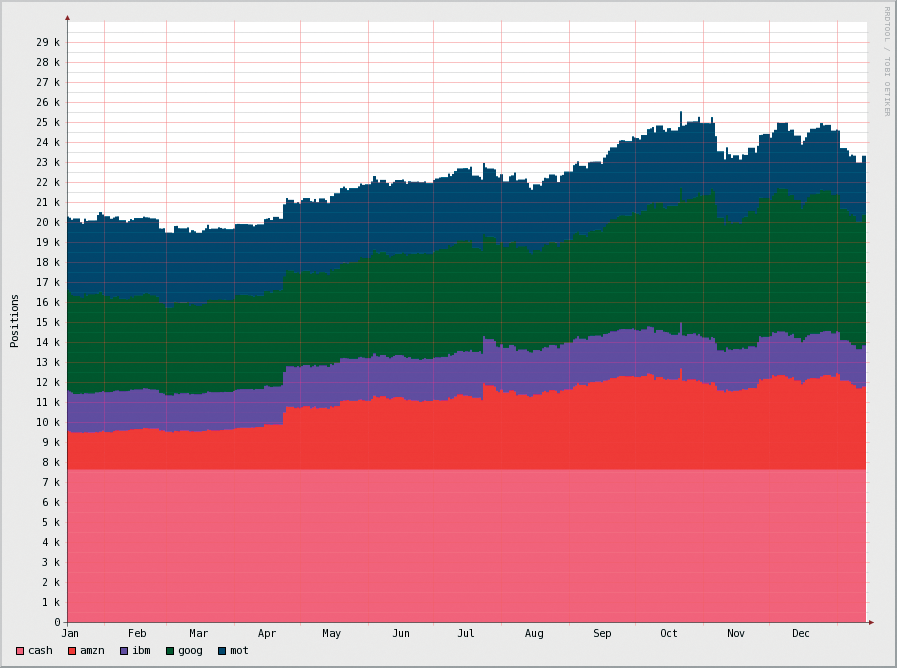
The balance of the portfolio in Figure 1 is exactly US$ 20,000 on January 1, 2007. Nine days later, the owner has acquired 50 Amazon shares, 20 IBM shares, 10 Google shares, and 200 Motorola shares at the applicable daily rates. The investor doesn't touch the portfolio for the rest of the year. The graph in Figure 3 shows how these four stocks have developed. While the Amazon and Google shares made considerable gains, Motorola performed poorly, affecting the performance of the portfolio as a whole at year end. All told, the portfolio was up slightly.
Meanwhile, the portfolio owner in Figure 2 invested US$ 20,000 and immediately spent the money on 200 CVS (the drugstore) shares. A week later, the investor bought 150 Amazon shares, which were sold again four months later. In September, the investor predicted a rise in the Google share price and invested in 30 shares.

The graph in Figure 4 shows a far higher return and also shows that the stack of share price graphs can cause confusion. The order in which the stocks are shown stays the same, but with some jumps on days in which the portfolio owner buys or sells shares. Also note the pink area at the bottom of the graph that represents the cash balance.
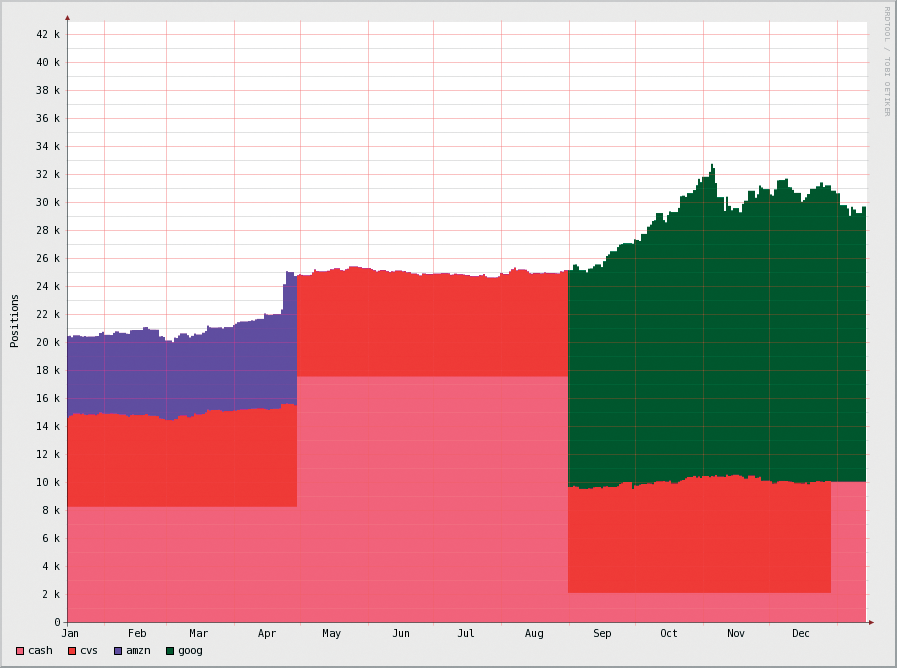
The portfolio graphs for both investors (Figures 3 and 4) were created by the pofo Perl script (Listing 2), which retrieves the buying and selling data of shares from a configuration file.
Later in this article, I will describe how the script works. The input files are shown in Figures 1 and 2. The script expects the configuration file as command-line parameter. Calling pofo pofo1.txt outputs an image file named positions.png with the graphs after a computation that can take up to several minutes if many different stock or long time frames need to be calculated.
| Listing 2: pofo |
001 #!/usr/bin/perl -w
002 #############################
003 # pofo - draw a stacked
004 #        portfolio graph
005 # Mike Schilli, 2008
006 # (m@perlmeister.com)
007 #############################
008 use strict;
009 use CachedQuote;
010 use DateTime;
011 use RRDTool::OO;
012 use Log::Log4perl qw(:easy);
013 # Log::Log4perl->easy_init(
014  $DEBUG);
015
016 my @colors =
017   qw(f35b78 e80707 7607e8
018   0a5316 073f6f 59b0fb);
019 my $cq = CachedQuote->new();
020
021 my ($cfg_file) = @ARGV;
022 die "usage: $0 cfgfile"
023   unless $cfg_file;
024
025 my @symbols;
026 my $acts =
027   cfg_read($cfg_file,
028            \@symbols);
029 my %pos = ();
030
031 my $end = DateTime->today();
032 my $start =
033   $end->clone->subtract(
034  years => 2);
035
036 for
037   my $act (sort keys %$acts)
038 {
039  next
040    if $acts->{$act}->[0]->[0]
041    >= $start;
042  pos_add(\%pos, $_)
043    for @{ $acts->{$act} };
044 }
045
046 my $counter = 0;
047 my %symbol_colors;
048 for (@symbols) {
049  my $idx =
050    ($counter++ % @colors);
051  $symbol_colors{$_} =
052    $colors[$idx];
053 }
054
055 unlink my $rrdfile =
056   "holdings.rrd";
057 my $rrd =
058   RRDTool::OO->new(
059  file => $rrdfile,);
060
061 $rrd->create(
062  step  => 24 * 3600,
063  start => $start->epoch() -
064    1,
065  map({
066    (
067     data_source => {
068      name => $_,
069      type => "GAUGE",
070     },
071    )
072   } @symbols),
073  archive => {
074   rows  => 5000,
075   cfunc => "MAX"
076  }
077 );
078
079 for ( my $dt = $start->clone;
080  $dt <= $end;
081  $dt->add(days => 1)) {
082
083  if (exists $acts->{$dt}) {
084   pos_add(\%pos, $_)
085     for @{ $acts->{$dt} };
086  }
087
088  my %parts = ();
089  my $total =
090    sum_up(\%pos, $dt,
091   \%parts);
092  INFO
093 "*** TOTAL *** = $total\n";
094
095  $rrd->update(
096   time   => $dt->epoch(),
097   values => \%parts,
098    )
099    if scalar keys %parts;
100 }
101
102 $rrd->graph(
103  width       => 800,
104  height      => 600,
105  lower_limit => 0,
106  image => "positions.png",
107  vertical_label =>
108    "Positions",
109  start => $start->epoch(),
110  end   => $end->epoch(),
111  map {
112   (
113    draw => {
114     type   => "stack",
115     dsname => $_,
116     color  =>
117       $symbol_colors{$_},
118     legend => $_,
119    }
120     )
121    } @symbols,
122 );
123
124 #############################
125 sub sum_up {
126 #############################
127  my ($all, $dt, $parts) = @_;
128
129  my $sum = 0;
130
131  for my $tick (keys %$all) {
132   my $q = 1;
133   $q = $cq->quote($dt, $tick)
134     if $tick ne 'cash';
135   my $add =
136     $all->{$tick} * $q;
137   $parts->{$tick} = $add;
138   $sum += $add;
139
140   DEBUG "Add: ",
141   "$all->{$tick} $tick $add";
142  }
143  return $sum;
144 }
145
146 #############################
147 sub pos_add {
148 #############################
149  my ($all, $pos) = @_;
150
151  my ($dt, $act, $tick, $n) =
152    @{$pos};
153  die "pos: @$pos"
154    if !defined $n;
155  DEBUG
156    "Action: $act $n $tick";
157
158  my $q = 1;
159  $q = $cq->quote($dt, $tick)
160    if $tick ne 'cash';
161  my $val = $n * $q;
162
163  if ($tick eq "cash") {
164   $all->{cash} += $val
165     if $act eq "in";
166   $all->{cash} -= $val
167     if $act eq "out";
168   $all->{cash} = $val
169     if $act eq "chk";
170  } else {
171   if ($act eq "in") {
172    $all->{$tick} += $n;
173    $all->{cash} -= $val;
174   } elsif ($act eq "out") {
175    $all->{$tick} -= $n;
176    $all->{cash} += $val;
177   } elsif ($act eq "find") {
178    $all->{$tick} += $n;
179   }
180   DEBUG "After: ",
181         "$tick: $all->{$tick}";
182  }
183
184  $all->{cash} ||= 0;
185  DEBUG "After: ",
186        "Cash: $all->{cash}";
187 }
188
189 #############################
190 sub cfg_read {
191 #############################
192  my ($cfgfile, $symbols) =
193    @_;
194
195  my %by_date = ();
196
197  open FILE, "<$cfgfile"
198    or die
199  "Cannot open $cfgfile ($!)";
200
201  while (<FILE>) {
202   chomp;
203   s/#.*//;
204   my @fields = split ' ', $_;
205       # empty line
206   next unless @fields;
207
208   my $dt =
209     dt_parse($fields[0]);
210   $fields[0] = $dt;
211
212   push @$symbols, $fields[2]
213     unless
214     grep { $_ eq $fields[2] }
215     @$symbols;
216
217   push @{ $by_date{$dt} },
218     [@fields];
219  }
220
221  close FILE;
222  return \%by_date;
223 }
224
225 #############################
226 sub dt_parse {
227 #############################
228  my ($string) = @_;
229
230  my $fmt =
231    DateTime::Format::Strptime
232    ->new(
233   pattern => "%Y-%m-%d");
234  return $fmt->parse_datetime(
235   $string);
236 }
|
For each day in the graph, pofo ascertains the individual stocks in the portfolio, retrieves the daily prices, and multiplies them by the number of shares. The RRDtool (Round Robin Database tool) [1], which is designed to visualize network traffic and computer load, stores the daily data and then pours it into an easily readable area graph. It assigns colors to the various stocks/securities from a predefined palette, and draws a legend at the bottom of the graph to explain the assignments.
Historic share prices for all known shares are available online; however, the script would be unbelievably slow if it were to retrieve the figures for each day you ask it to display. Instead, the script uses the CachedQuote module from Listing 1, so the first time you request the price for a share, it retrieves all the prices in a time window starting one year in the past and reaching up to the current day. All values, whether it needs them or not, are stored locally in an SQLite database for subsequent use.
| Listing 1: CachedQuote.pm |
001 #############################
002 package CachedQuote;
003 # Cache stock closing prices
004 # Mike Schilli, 2008
005 # (m@perlmeister.com)
006 #############################
007 use strict;
008 use warnings;
009 use Cache::Historical;
010 use Log::Log4perl qw(:easy);
011 use
012   Finance::QuoteHist::Yahoo;
013
014 #############################
015 sub new {
016 #############################
017  my ($class, %options) = @_;
018
019  my $self = {
020   file =>
021     "/tmp/cached-quote.dat",
022   %options,
023  };
024
025  $self->{cache} =
026    Cache::Historical->new(
027   sqlite_file =>
028     $self->{file});
029
030  bless $self, $class;
031 }
032
033 #############################
034 sub quote {
035 #############################
036  my ($self, $date, $key) =
037    @_;
038
039  my $quote =
040    $self->{cache}
041    ->get($date, $key);
042
043  return $quote
044    if defined $quote;
045  $self->quote_refresh($date,
046   $key);
047
048  return $self->{cache}
049    ->get_interpolated($date,
050   $key);
051 }
052
053 #############################
054 sub quote_refresh {
055 #############################
056  my ($self, $date, $symbol) =
057    @_;
058
059  my ($from, $to) =
060    $self->{cache}
061    ->time_range($symbol);
062
063  my $upd =
064    $self->{cache}
065    ->since_last_update(
066   $symbol);
067
068  # Date available, no refresh
069  if ( defined $to
070   and defined $from
071   and $date <= $to
072   and $date >= $from)
073  {
074   DEBUG
075    "Date within, no refresh";
076   return 1;
077  }
078
079  if ( defined $date
080   and defined $to
081   and defined $upd
082   and $date > $to
083   and $upd->delta_days < 1) {
084   DEBUG "Date ($date) above",
085   " cached range $from-$to",
086   " but cache up-to-date.";
087   return 1;
088  }
089
090  my $start =
091    $date->clone->subtract(
092   years => 1);
093  if ( defined $start
094   and defined $from
095   and $start > $from
096   and $to > $start)
097  {
098
099 # no need to refresh old data
100   $start = $to;
101  }
102
103  $self->quotes_fetch($start,
104   DateTime->today(),
105   $symbol);
106 }
107
108 #############################
109 sub quotes_fetch {
110 #############################
111  my ($self, $start,
112      $end,  $symbol) = @_;
113
114  DEBUG "Refreshing $symbol ",
115    "($start - $end)";
116
117  my $q =
118    Finance::QuoteHist::Yahoo
119    ->new(
120   symbols    => [$symbol],
121   start_date =>
122     date_format($start),
123   end_date =>
124     date_format($end),
125    );
126
127  foreach
128    my $row ($q->quotes()) {
129   my ($symbol, $date, $open,
130    $high, $low, $close,
131    $volume) = @$row;
132
133   $self->{cache}
134     ->set(dt_parse($date),
135    $symbol, $close);
136  }
137 }
138
139 #############################
140 sub date_format {
141 #############################
142  my ($dt) = @_;
143  return $dt->strftime(
144   "%m/%d/%Y");
145 }
146
147 #############################
148 sub dt_parse {
149 #############################
150  my ($string) = @_;
151  my $fmt =
152    DateTime::Format::Strptime
153    ->new(
154   pattern => "%Y/%m/%d");
155  $fmt->parse_datetime(
156   $string);
157 }
158
159 1;
|
When the client requests the next daily share price, CachedQuote simply reads the value from its database repository instead of loading the values over the network. The client does not notice anything, apart from a far faster response to subsequent requests.
If a customer queries a share price on a Sunday, CachedQuote notices that there is no share price for the day in question because stock exchanges do not work on weekends and public holidays. In this case, CachedQuote is intelligent enough to return the last available price instead of a black hole.
The CachedQuote.pm module uses the Finance::QuoteHist::Yahoo CPAN module to retrieve the share price data off the web (Listing 1, lines 12, 109-137). The cache retrieves the closing price, which it stores in the $close variable. On receiving a web request, the Yahoo server can return the share price data for a single share for many years. CachedQuote.pm leverages this and sends a request to the server, requesting the data for one year prior to the requested time up to the current day (line 103). If the data is available in the cache, the module does not issue a new request (line 43).
CachedQuote.pm uses the Cache::Historical CPAN module to store and retrieve the share price data. The module has a convenient interface for setting date-based values, set(date, key, value). To retrieve stored values it offers the get(date, key) and get_interpolated(date, key) methods. The key parameter works like the key in a hash. If a share price is missing for a specific day, get_interpolated() retrieves the last available price prior to the given date while get will return the data on a specific date or undef if no data exists for that date.
Cache::Historical accesses an SQLite database via the DBD::SQLite CPAN module. SQLite is not under the GPL, but is released under a Public Domain license; the CPAN module includes the source code for the file-based database. SQLite supports requests in SQL syntax but does without a database server, writing the results directly to a local file instead.
CachedQuote.pm sets the SQLite database file to /tmp/cached-quote.dat in line 21. If you prefer not to leave the cache in a dangerous temporary directory, you can change the default when you call the Cache::Historical constructor - for example, new(sqlite_file => "filename").
The quote() function (line 34) first tries to retrieve the stock price with get() (lines 39-41). If this action fails, the get() method returns an undefined value, which is recognized in line 44. Then the module calls quote_refresh() to update the cache for the period before and after the requested date. After this, get_interpolated() should return a useful value.
At the same time, the code decides whether the daily price is unavailable because the stock exchange was closed on the day in question or because the range is not yet cached. If the script discovers that the day was a Sunday, the module should not try to retrieve the latest share prices from the server because there will not be any until Monday.
Therefore, the quote_refresh() function calls since_last_update() in line 65 to check the period since the last cache refresh. This value is stored as a DateTime::Duration object, and delta_days converts this to whole days. If the cache is less than one day old, an update is not performed (lines 69-72, 79-83), and the last available share price (typically from Friday) is then used (interpolation method in line 49).
The CPAN DateTime module interface is so convenient that developers normally do not bother using anything else, but the Finance::QuoteHist::Yahoo module insists on dates in US standard format: mm/dd/yyyy. Thus, the date_format() function in line 140 calls the strftime() method to convert DateTime objects.
The reverse case - converting a mm/dd/yyyy date to a DateTime object - is handled by the dt_parse() function beginning in line 148.
The DateTime::Format::Strptime module defines a new format; the module's parse_datetime() method analyzes a string passed in to it and returns a new object if successful.
To calculate the date one year ago from a DateTime object, all you need to do is call the object's subtract() method with the years => 1 parameter. Of course, this modifies the object itself.
If you need the original value, you first need to copy the contents to a new object with clone() (line 91).
The pofo script (Listing 2) accepts a configuration file, such as pofo1.txt in Figure 1, at the command line. The cfg_read() function starting in line 190 works its way through the lines of the file, each of which describes a share transaction. The function ignores comments starting with a pound sign, # (line 203) and lines that contain nothing but blanks and comments.
Because the dates are formatted yyyy/mm/dd, pofo has a dt_parse() function (line 226) to define the format and convert the date entries to DateTime objects. As an additional service, the cfg_read() function accepts a reference to the @symbols array, which it populates with all ticker symbols that occur, avoiding duplicates (lines 212-215).
The function returns a reference to the%by_date hash that it populates. The keys in this hash are date values in the form of stringified DateTime objects. The values are each mapped to an array of transactions that have taken place on the same days (line 217). In turn, each transaction comprises an array that contains the fields from the corresponding configuration file line - that is, date, action, ticker symbol, and the number of shares. Cash actions also occur here with cash as their ticker symbol.
To see how many shares of one stock the portfolio holds on a specific day, the script needs to work its way through the transactions that occurred in the portfolio up to this date. Therefore, the for loop starting in line 36 first works its way through all actions before the $start date. The hash keys are dates, which the sort command sorts in ascending order.
The loop calls the pos_add() function for each transaction and puts the results in the %pos hash. The hash assigns a numeric value to each ticker symbol in the portfolio. For shares, this is the number, and for cash, this is simply the sum. The second for loop starting in line 79 then does the same calculation for every single day after the start date, until the current date.
Share acquisitions and sales additionally trigger a movement in the cash item; new shares cost money, and the proceeds from selling shares are credited to the account. On every action, the daily share price is applied; the data is provided by CachedQuote.pm.
The area graph for the individual items comes courtesy of RRDtool by Tobias Oetiker [1]. The object-oriented RRDTool::OO CPAN module helps to Perlify and elucidate the unusual syntax of this practical tool.
RRDtool stores data from RRD archives by cumulating the measuring points of one or more data sources. In predefined intervals, the so-called step size, an average is calculated. In line 62 of Listing 2, the pofo program sets the step parameter to 24 hours, telling the RRD database to expect just one update per day. The program assigns a separate data source to each stock (map() call in lines 65-72).
The RRD archive can store up to 5,000 values (line 74) before it starts to overwrite the values in typical RRD style. At a rate of one new value a day, it will take more than 10 years for this to happen. The GAUGE parameter in line 69 stipulates that RRDtool should accept the values directly and not cumulate them; however, RRDtool refuses to accept values for times prior to the last stored daily value; to cope with this, pofo deletes any remaining RRD files in line 55 and the RRDTool::OO constructor quickly recreates them.
Line 16 of Listing 2 defines a freely selectable color palette of RGB values. In lines 46-53, pofo selects a value for each share to be displayed from the @colors array, allowing the viewer to distinguish the stocks in the graph.
The %symbol_colors hash holds the symbol/color palette mappings. The order in which the actions occur in the configuration file defines the display order in the graph.
The for loop starting in line 79 works its way through the days to be displayed in the graph. Each time it does, the if condition in line 83 checks to see whether transactions are available for the current day and, if so, calls pos_add() to add them, thus ensuring that the global hash %pos contains the current portfolio configuration.
The sum_up() function then determines the daily balance of the portfolio and stores the cash values of the individual items in the %parts hash index by the share ticker keys (or cash). After this, the RRD object's update() method passes the hash in to the RRD database, applying the time stamp for the day that has just been processed (line 95). The graph() method finally draws the graph output in the positions.png file and writes the legend at the bottom edge of the image (lines 102-122). The listing shown here only uses six colors for shares, but nothing prevents you from adding new colors to the @colors array in lines 16-18.
In lines 31-34, pofo sets the display period to two years in the past until today. You can change this by modifying the $start and $end variables. If you prefer more information on what is going on during the data processing state, just uncomment line 13; easy_init() then initializes Log4perl, and the output from the DEBUG instructions spread liberally throughout the source code will be directed onto your screen.
The script has no concept of stock splits, in which the historic share price data is changed in retrospect, thus leaving invalid data in the cache. In this case, you would need to delete the cache file, /tmp/cached-quote.dat, thereby removing the whole cash. Filling the file again will not take much effort because web requests to the financial servers efficiently retrieve high volumes of data. Enjoy watching your wealth grow!
| INFO |
|
[1] RRDtool: http://www.rrdtool.org
[2]: Listings for this article: http://linux-magazine.com/resources/article_code |
| THE AUTHOR |
|
Michael Schilli works as a Software Developer at Yahoo!, Sunnyvale, California. He wrote "Perl Power" for Addison-Wesley and can be contacted at mschilli@perlmeister.com. His homepage is at http://perlmeister.com. |