
By Matthew D. Sacks
Linux admins often benefit from capturing system performance metrics such as disk utilization, CPU usage, and memory usage. A handy performance chart helps in diagnosing problems and analyzing traffic issues.
Multi-Router Traffic Grapher (MRTG) [1] lets you collect and graph network and performance data from Linux hosts. MRTG is an open source graphing tool that collects and displays statistics from SNMP-based network devices.
Commercial tools, such as HP's OpenView or IBM's Tivoli, as well as open source utilities, such as Cacti and Zenoss (a beefed-up version of MRTG), serve a similar role, but in my opinion, MRTG is the best solution for trending and collecting server performance data.
| Credits |
|
Thank you to Tobi Oetiker for giving permission to reprint installation and pre-requisite information from his website [1] - and for making such a useful networking tool. Thank you to Safdar Husain for taking the time to show me the world of Systems Administration. |
Setting up MRTG and SNMP is not for the faint of heart, especially if you choose to compile all of the necessary software packages from source. Check your package management system to see whether MRTG packages are available for your distribution. If not, you'll find source code at the website of MRTG creator Tobi Oetiker [1].
SNMP is the protocol beneath the magic pictures drawn by MRTG. This article assumes you have some basic knowledge of SNMP. If not, the Internet has abundant information on the somewhat archaic but incredibly powerful SNMP network protocol. For more information on how to get SNMP up and running on a Linux host, look online [2].
See the box titled "MRTG Prerequisites" for information on the background components required by MRTG. Once you have installed the prerequisites, download the MRTG source code [1].
Unzip and untar the installation package from a temporary installation directory, and run the following commands:
tar -xvzf mrtg.tar.gz
cd mrtg-2.15.2
./configure --prefix=/usr/local/mrtg-2.15.2
You might want to make a symbolic link to reference the latest build, which will allow for easy upgrades or testing new versions by just changing the symbolic link:
ln -s /usr/local/mrtg-2.15.2 /usr/local/mrtg
If the MRTG configuration script can't find some dependency, you might receive an error message similar to the message shown in Listing 1.
| Listing 1: MRTG Configuration Problems |
01 ** Ooops, one of many bad things happened: 02 03 a) You don't have the GD library installed. 04 Get it from http://www.boutell.com, compile it, and 05 use either --with-gd-lib=DIR or --with-gd-inc=DIR to specify 06 its location. You might also have to use --with-z-inc, 07 --with-z-lib and --with-png-inc, --with-png-lib for gd 08 versions 1.6 and higher. Check config.log for more 09 information on the problem. 10 11 b) You have the GD library installed, but not the gd.h 12 header file. Download the source (see above) and use 13 --with-gd-inc=DIR to specify where the file can be found. 14 15 c) You have the library and the header file installed, but 16 you also have a shared GD library in the same directory. 17 Remove the shared library files and/or links (e.g., 18 libgd.so.2.0.0, libgd.so and libgd.so.2). This is especially 19 likely if you're using a recent (post 1.8.4) version of GD 20 and didn't configure it with --disable-shared. 21 22 d) You have the GD library installed and also its headers, but you are 23 missing libpng (and headers) or freetype (and headers) 24 (MRTG does not use freetype, but if your copy of GD is precompiled 25 against it, you have to install it ... ) |
It is a good idea to download all of the latest stable versions of the software libraries that the MRTG configure script is complaining about, even if they already appear to be present on the host. MRTG will then have access to the latest code with the fewest (hopefully) bugs.
| MRTG Prerequisites |
|
Before you try to install MRTG, make sure you have the following:
|
To compile MRTG, change to the directory with the MRTG installation source:
cd /tmp/mrtg_source
./configure -prefix=/usr/local/mrtg-2.15
If any library dependencies were compiled from source, modify your configuration script parameters to include these dependency libraries. For example, if the GD software library was downloaded and installed from source, modify your configure script as follows:
./configure -prefix=/usr/local/mrtg-2.15 --with-gd-lib=/usr/local/gd-2.0.34 --with-gd-inc=/usr/local/gd-2.0.34/lib
make
make install
to include the GD library.
This article will use two Linux hosts as examples: Tux and Grapher. Tux is the Linux host from which we want to collect and graph performance data, and Grapher is the Linux host running MRTG.
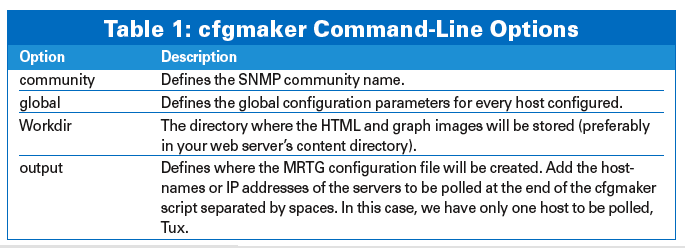
MRTG configuration files are complex and cumbersome to edit by hand, which is why MRTG comes with an easy-to-use configuration script. The cfgmaker configuration script offers many options. Use cfgmaker to populate the mrtg.conf file with the necessary data for generating basic graphs. The most basic cfgmaker command-line arguments are shown in Table 1. Before executing the cfgmaker script, create a directory for holding MRTG configuration files, because you might use a number of different configurations on a single host:
mkdir /usr/local/mrtg/cfg
Execute the cfgmaker script as follows:
/usr/local/mrtg/bin/cfgmaker --community=public --global Options[_]:growright,avgpeak,printrouter --global Workdir:/usr/local/apache2/htdocs --output=/usr/local/mrtg/cfg/mrtg2.cfg Tux
As I explained earlier in this article, MRTG receives its information through SNMP. The SNMP protocol organizes device addressing information in a hierarchical structure known as a Management Information Base (MIB). The following example assumes the UCD-SNMP MIB is loaded and data can be polled using this MIB definition. In order to test whether or not the UCD-SNMP MIB is available, check your SNMP installation to verify that it is loaded.
A quick way to test whether the UCD-SNMP MIB is available is by using the following command against the Linux server you are polling:
snmpwalk -v1 -c public hostname ssCpuRawUser
This command queries the CPU usage number for user time against the target host.
If this command fails, check to see if SNMP is running on the target host and ensure that the syntax of the snmpwalk command is correct (see the snmpwalk man page). Also, make sure the UCD-SNMP MIB is installed.
Now that you have generated a standard mrtg2.cfg file using the cfgmaker script, you must manually edit mrtg2.cfg in order to graph resource statistics such as memory, disk, and CPU usage.
The MRTG website has excellent documentation on all of the different parameters for configuring MRTG.
This example describes how to create a very simple template to chart CPU usage.
The UCD-SNMP MIB lets you monitor a wide range of additional performance-related settings. To see what is available, check out the MIB definition [7].
To add a parameter such as CPU usage to the MRTG configuration, start by creating the following directories to house the new custom configurations:
mkdir /etc/mrtg
mkdir /etc/cron.mrtg
Then create a cpu.cfg file to monitor the CPU load using the contents shown in Listing 2. Create a cron job file for the CPU monitoring job:
vi /etc/cron.mrtg/cpu
with the following contents:
#!/bin/sh
env LANG=C /usr/local/mrtg/bin/mrtg /etc/mrtg/cpu.cfg
With the following command, make the cpu.cfg file executable:
chmod +x /etc/cron.mrtg/cpu
To generate some graph data, execute the script about three times:
sh /etc/cron.mrtg/cpu
(You might encounter some warnings that you can safely ignore.) To view the results, create the index file using the indexmaker script:
indexmaker --output=/usr/local/apache2/htdocs/mrtg/cpu_index.html --title="CPU Usage" --sort=name --enumerate /etc/mrtg/cpu.cfg
Finally, add a super cron containing the custom OIDs:
*/5 * * * * /bin/run-parts /etc/cron.mrtg 1> /dev/null
To graph any other system metrics, such as memory, average users, and disk usage, consult the USD-SNMP MIB definition [7] and simply repeat the preceding steps, modifying the OID and graph legend parameters.
| Listing 2: cpu.cfg |
01 ## Graph Tux CPU ## 02 WorkDir: /usr/local/apache2/htdocs/mrtg 03 LoadMIBs: /usr/share/snmp/mibs/UCD-SNMP-MIB.txt 04 Target[Tux.cpu]:ssCpuRawUser.0&ssCpuRawUser.0:linux-magazine@Tux + 05 ssCpuRawSystem.0&ssCpuRawSystem.0:public@Tux + 06 ssCpuRawNice.0&ssCpuRawNice.0:public@Tux 07 RouterUptime[Tux.cpu]: public@Tux 08 MaxBytes[Tux.cpu]: 100 09 Title[Tux.cpu]: CPU Load 10 PageTop[Tux.cpu]: <H1>Active CPU Load %</H1> 11 Unscaled[Tux.cpu]: ymwd 12 ShortLegend[Tux.cpu]: % 13 YLegend[Tux.cpu]: CPU Utilization 14 Legend1[Tux.cpu]: Active CPU in % (Load) 15 Legend2[Tux.cpu]: 16 Legend3[Tux.cpu]: 17 Legend4[Tux.cpu]: 18 LegendI[Tux.cpu]: Active 19 LegendO[Tux.cpu]: 20 Options[Tux.cpu]: growright,nopercent |
Now you have created a template for configuring custom system-resource-specific graphs for performance data. The next step is to choose a polling interval for collecting the data. Do this by plugging the path to the MRTG binary and executing it on the desired interval using cron.
To edit the crontab, type crontab -e and add the following entry:
0,5,10,15,20,25,30,35,40,45,50,55 * * * * env LANG=C /usr/local/mrtg/bin/mrtg /usr/local/mrtg/cfg/mrtg2.cfg
This entry will run the MRTG binary every five minutes and will populate the graphs. If a cron job is not set up to execute the MRTG binary, graph data will not be populated. You can adjust the polling interval as desired, but keep in mind that the less frequently polling occurs, the less accurate the graph will be.
Depending on how your web server is set up, you may have to reference the specific filename that was generated by the MRTG scripts.
In this example, Apache was used and the files were generated in the WorkDir directory.
The indexmaker tool created an index file, which you will find in /usr/local/apache2/htdocs/mrtg/cpu_index.html. Open this URL in a browser to see the CPU graph.
Filenames are sometimes generated automatically, so it is best to look in the output directory for the filename, and then input that filename into the browser URL.
Now after all of this hard work, you should have beautifully crafted graphs and a global summary view of a single system. By re-running indexmaker or customizing a portal that displays dynamically created PNG images, you can scale your MRTG installation to include performance metrics and data from a small to large enterprise infrastructure.
RRDtool, the round robin database tool [8], will allow better performance and more customization of MRTG graphs. Use RRDtool when deploying MRTG to a large number of Linux hosts.
Generally speaking, MRTG graphs are most effective when viewed and interpreted on a regular basis. It is best to record some sort of baseline graph and use that as a comparison when troubleshooting or investigating problems.
For example, Figure 1 shows a group of servers under normal load. (Note that the ability to aggregate multiple servers onto a single graph like this is a feature of RRDtool, which is an add-on to MRTG.) Most of the time, a consistent pattern develops on the graph over time.
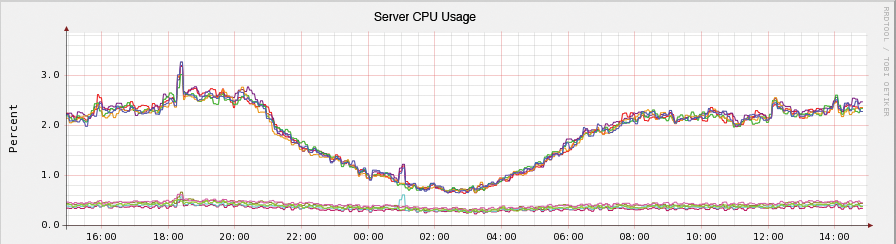
If a spike occurs at midnight on the server CPU graph (Figure 2), one possible explanation is a backup job scheduled at midnight. Another possibility is that there was some kind of attack on the server farm. In order to decide between these two scenarios, you can compare the CPU usage graphs against the network traffic graphs (Figure 3).

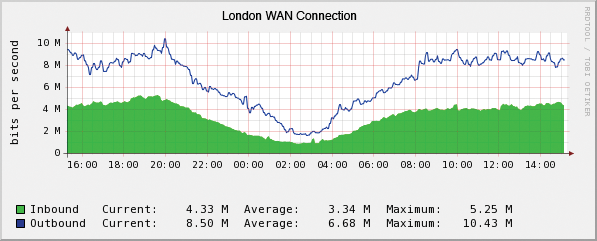
The network graph shows no spike in network traffic at the same time as the server CPU usage graph, so it is safe to say there was no external attack on the server farm. The next step would be to investigate the server or backup logs to see whether some sort of scheduled job was executed at this time.
MRTG lets the system administrator quickly pinpoint and investigate changes in system performance.
In this article, I've shown just a small fraction of the possibilities for graphing data and troubleshooting system performance with MRTG.
| INFO |
|
[1] MTRG: http://oss.oetiker.ch/mrtg/
[2] Net-SNMP: http://www.net-snmp.org [3] GCC: http://gcc.gnu.org [4] GD library: http://www.boutell.com/gd/ [5] libpng: http://www.libpng.org/pub/png/libpng.html [6] zlib: http://www.gzip.org/zlib [7] UCD-SNMP MIB definition: http://www.oidview.com/mibs/2021/UCD-SNMP-MIB.html [8] RRDtool: http://oss.oetiker.ch/rrdtool |