
By Michael Schwartzkopff
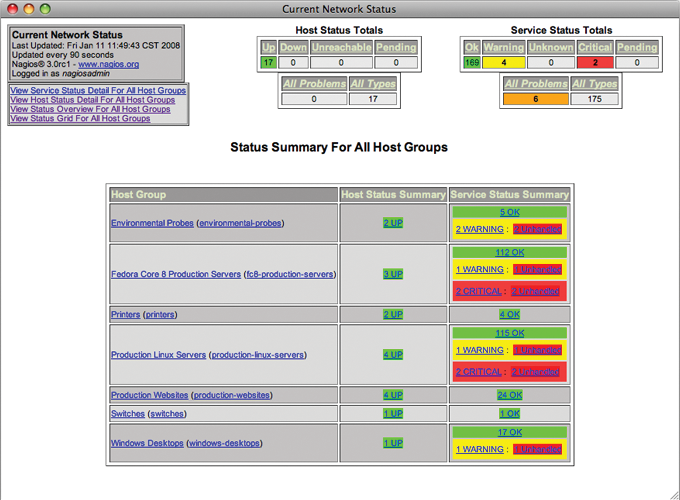
If you need to manage a large number of computers and services, Nagios [1] is an excellent option. Nagios monitors computers, network connections, and servers, displaying the current health state of a web interface with the colors green (okay), yellow (warning), and red (critical) (Figure 1). It is a pity that the web interface is so unobtrusive. If everything is quiet on the network front, an administrator can easily close the browser window and overlook the Nagios warning messages in the general flood of email traffic.
One day, I decided there must be a better way. Luckily, Nagios is very easy to adapt and extend. With a little scripting and some cheap electronic hardware, I built a simple traffic light that can sit on top of a switch, cabinet, or desk to show the current network status (see Figure 2).
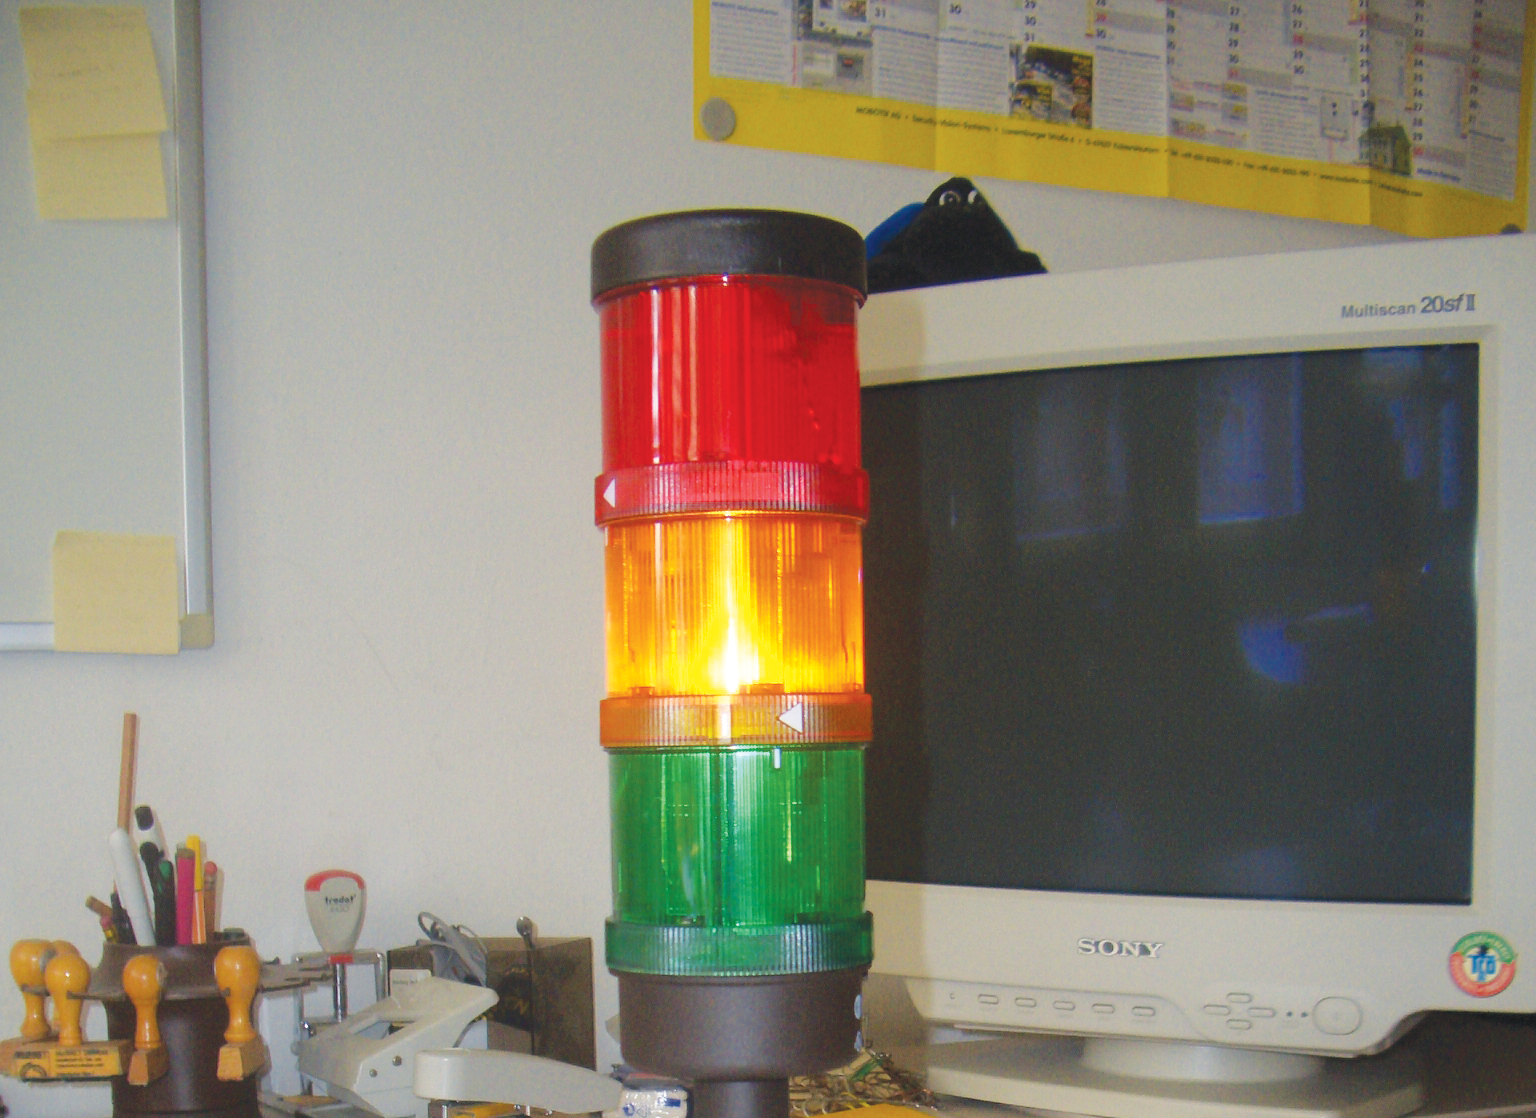
The traffic light provides a far more tangible clue about the network status than any web interface ever could.
If the traffic switches from green to yellow or red, the network manager knows it's time to launch the browser and ask Nagios what has caused the change. While the traffic light is showing green, the administrator can carry on with daily business. And believe me, it's great to walk into the office early in the morning, see a friendly green light, and know that it's going to be a good day.
In this article I describe how I implemented my network status traffic light. Of course, if you decide to build a similar device, the details will differ depending on the electronic components available in your part of the world, but this exercise gives a good idea of how easy it is to build custom solutions on Nagios.
Instead of displaying thousands of individual states like the web interface, the traffic light simply gives a highly intuitive summary of the overall status of all of your hosts and services. The first obstacle is to ascertain the status of all the network hosts and services. The best way to do this is to let the monitoring software write the data to a database.
The NDOUtils extension for Nagios is the perfect choice for this. Any application with access to the database can evaluate the central hoststatus and servicestatus tables; depending on the installation, these tables might have a nagios_ prefix. The following query establishes the host status:
SELECT current_state FROM nagios_hoststatus;
A value of 0 tells you that the host is reachable; 1 stands for an availability issue, and 2 represents an unknown status. In a similar way, you can query service states:
SELECT current_state FROM nagios_servicestatus;
The four service status settings are: 0 for okay, 1 for warning, 2 for critical status, and 3 for unknown status. The traffic light only responds to problematic states that have just occurred and that the administrator has not taken care of. To account for this, the complete host query looks like this:
SELECT * FROM nagios_hoststatus
WHERE current_state > 0
AND problem_has_been_acknowledged = 0;
If this query returns a response, the traffic light should turn red; otherwise, you can check the service status (nagios_servicestatus) with a similar query. If the service status is 2 or 3, any matches should turn the traffic light red. If a service status of 1 returns a hit, the light should turn yellow. Of course, querying for problematic services is more complex than this, in that all the services on a machine are in a critical state if the computer is unreachable.
Once the administrator has acknowledged the issue and clicked the Acknowledged box for the host, the red light should be switched off to avoid missing other failures.
The Nagios configuration table is required to define the link between services and the machines on which they are running: The database does not have a direct reference between the service state tables and the hosts (Figure 3 [2]). The complete query for critical states is shown in Listing 1.
![]()
| Listing 1: Critical Services |
01 SELECT * FROM ((nagios_servicestatus 02 INNER JOIN nagios_services 03 ON nagios_servicestatus.service_object_id 04 =nagios_services.service_object_id) 05 INNER JOIN nagios_hosts 06 ON nagios_services.host_object_id 07 =nagios_hosts.host_object_id) 08 INNER JOIN nagios_hoststatus 09 ON nagios_hosts.host_id 10 =nagios_hoststatus.hoststatus_id 11 WHERE nagios_servicestatus.current_state > 1 12 AND nagios_servicestatus.problem_has_been_acknowledged=0 13 AND nagios_hoststatus.problem_has_been_acknowledged=0; |
The structure of the configuration, log, and status files provides the design for the tables in this simple database. This might sound convenient, but it actually makes queries more difficult. It makes more sense to design a database on database modeling criteria.
Your electronics dealer will have all the components you need for the do-it-yourself part of the job. To build a traffic light - or signal beacon if you prefer - you need electronic components that let a program running on your computer switch the lights.
To implement this, you can use the RS-232 interface.
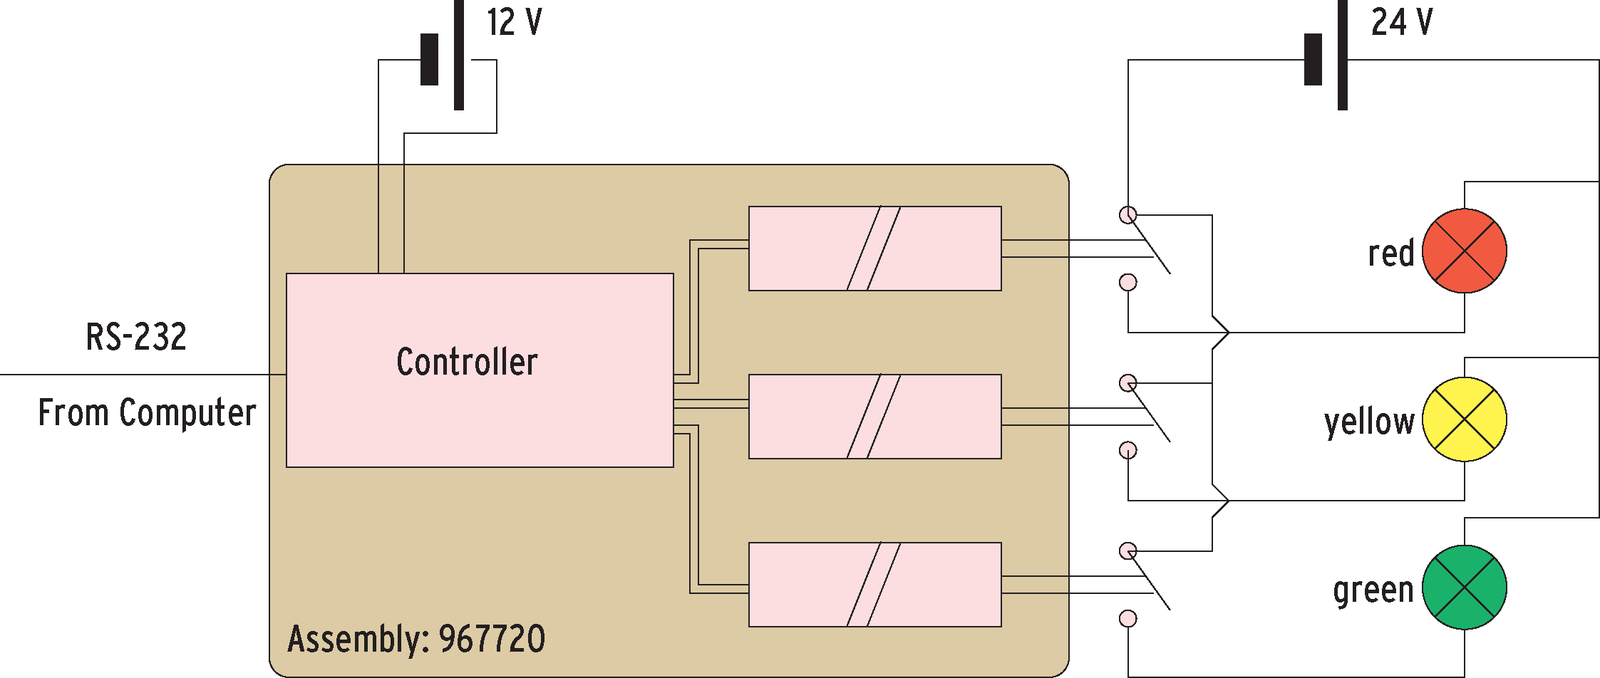
The components for my traffic light came from Conrad Electronic [3]. My traffic light uses 24-volt lighting elements. Article 967720-62 in the Conrad catalog is a relay module that the computer can control via the serial RS-232 interface. Unfortunately, the module can only handle 15 volts maximum, so I needed two power supplies: one with 12 and the other with 24 volts. The remaining components, such as illuminants, connecting elements, a housing for the assembly (Euro PCB), and a serial cable cost me about EUR 200.
Most of the electrical connections are screw-type, and you will only need your soldering iron for the male and female connectors on the power supply, so you don't need to be a rocket scientist to build the hardware. Figure 4 shows the wiring diagram.
If your computer does not have a legacy serial interface, a serial USB converter will do the trick. The Linux kernel automatically detects the converter, which probably has a PL2303 chip, and makes it available to applications as /dev/ttyUSB0. A new device is reported when you plug in the adapter.
To make sure that communications with the relay module work, you need to set the interface parameters, such as the speed.
A call to stty takes care of this:
stty -F /dev/ttyUSB0 19200 min 0 -icanon -ixon brkint imaxbel
Each command for the relay module comprises 4 bytes.
The first byte sets the command type (get, set, ?), and the second sets the module's address. Because I only have one module, this is always going to be 1. The computer passes in the data in the third byte, with each bit corresponding to a single relay.
The fourth byte is a simple XOR of the first 3 bytes to provide a checksum:
echo -en ,\0001\0001\0000\0000'>/dev/ttyUSB0
echo -en ,\0003\0001\0001\0003'>/dev/ttyUSB0
The first command initializes the assembly, and the second command switches on the first relay.
The syntax is described in the manual for the assembly.
The program in Listing 2 initializes the interface and the relay module (lines 4 and 5) before reading the database table status in an infinite loop (starting in line 8), which it then evaluates to switch the traffic lights.
| Listing 2: Traffic Light Control |
01 #!/bin/bash 02 # 03 # Initialization 04 stty -F /dev/ttyUSB0 19200 min 0 -icanon -ixon brkint imaxbel 05 echo -en ,\0001\0001\0000\0000' > /dev/ttyUSB0 06 # 07 # Infinite loop 08 while true ; do 09 LAMP=0 10 RESULT=`echo " 11 SELECT instance_id 12 FROM nagios_hoststatus 13 WHERE current_state <> 0 14 AND problem_has_been_acknowledged = 0;" 15 | mysql -u nagios -h db_host nagios | wc -l` 16 if (( $RESULT > 0 )) ; then 17 # A host has a problem -> red light 18 echo -en ,\0003\0001\0004\0006' > /dev/ttyUSB0 19 LAMP=1 20 # Lamp is set 21 fi 22 23 if [[ $LAMP = "0" ]] ; then 24 RESULT=`echo " 25 SELECT nagios_servicestatus.service_object_id 26 FROM ((nagios_servicestatus 27 INNER JOIN nagios_services 28 ON nagios_servicestatus.service_object_id=nagios_services.service_object_id) 29 INNER JOIN nagios_hosts 30 ON nagios_services.host_object_id=nagios_hosts.host_object_id) 31 INNER JOIN nagios_hoststatus 32 ON nagios_hosts.host_id=nagios_hoststatus.hoststatus_id 33 WHERE nagios_servicestatus.current_state > 1 34 AND nagios_servicestatus.problem_has_been_acknowledged=0 35 AND nagios_hoststatus.problem_has_been_acknowledged=0;" 36 | mysql -u nagios -h db_host nagios | wc -l` 37 if (( $RESULT > 0 )) ; then 38 # Service is critical -> red lamp. 39 echo -en ,\0003\0001\0004\0006' > /dev/ttyUSB0 40 LAMP=1 41 fi 42 fi 43 44 if [[ $LAMP = "0" ]] ; then 45 RESULT=`echo " 46 SELECT nagios_servicestatus.service_object_id 47 FROM ((nagios_servicestatus 48 INNER JOIN nagios_services 49 ON nagios_servicestatus.service_object_id=nagios_services.service_object_id) 50 INNER JOIN nagios_hosts 51 ON nagios_services.host_object_id=nagios_hosts.host_object_id) 52 INNER JOIN nagios_hoststatus 53 ON nagios_hosts.host_id=nagios_hoststatus.hoststatus_id 54 WHERE nagios_servicestatus.current_state = 55 AND nagios_servicestatus.problem_has_been_acknowledged= 56 AND nagios_hoststatus.problem_has_been_acknowledged=0;" 57 | mysql -u nagios -h db_host nagios | wc -l` 58 if (( $RESULT > 0 )) ; then 59 # Service warning status -> yellow lamp. 60 echo -en ,\0003\0001\0002\0000' > /dev/ttyUSB0 61 LAMP=1 62 fi 63 fi 64 65 if [[ $LAMP = "0" ]] ; then 66 # No problems -> green lamp 67 echo -en ,\0003\0001\0001\0003' > /dev/ttyUSB0 68 fi 69 70 sleep 30 71 LAMP=0 72 done |
The user nagios can access the nagios database on the host db_host without a password. The first database query, in lines 11 through 14, ascertains the hosts with critical status. I am only interested in the numbers here, which is why line 15 ends with wc -l, and the RESULT variable is set to the number of lines.
If the value is greater than 0, line 18 switches on the red light.
The next two queries identify critical services; they differ in lines 33 and 54: If the status is greater than 1, the red light is switched on (line 39), whereas the yellow light is activated for a status of 1 (line 60).
Finally, line 67 switches the traffic light back to green if everything is okay (LAMP="0").
Here's hoping that your network never needs the red and yellow lamps and that the friendly green light is the first thing you see every day when you walk into your office.
| INFO |
|
[1] Nagios: http://www.nagios.org
[2] NDOUtils database documentation: http://nagios.sourceforge.net/docs/ndoutils/NDOUtils_DB_Model.pdf [3] Conrad Electronic: http://www.conrad.com/ |
| THE AUTHOR |
|
Michael Schwartzkopff works as a consultant for Multinet Services. He was bitten by the Linux bug in 1994 when he first set sight on a Yggdrasil distribution. |