
By Markus Feilner and Bastian Kames
Server performance is down or non-existent. To look for clues, you check the logfiles, take a quick look at the /proc directory, and run tools such as Vmstat or Top, but to no avail: time to launch the Sysstat collection [1]. Sysstat is a group of simple Linux command-line tools for performance analysis and monitoring. According to the Sysstat project, the toolset "... contains various utilities common to many commercial Unixes, and tools you can schedule via cron to collect and historize performance and activity data."
The Sysstat set collects system information, stores it for a period of time, and calculates mean values, letting you query individual system parameters at specific times for more flexible troubleshooting. The tools work well with cron so that you can take readings of system performance at predefined intervals for a flexible, customizable approach to data collection. The Sysstat project defines the collection as follows:
The sar set includes the data collector sadc; sa1, which assembles binary data in a system activity file; sa2, which writes activity reports; and sadf, a tool used to display sar data in formats such as CSV and XML. kSar, which is available as a separate project [2], is a convenient graphing tool for sar data.
The Sysstat tools provide a practical, simple set of building blocks that are easy to integrate into the everyday life of the network.
| Get a Recent Linux |
|
Pidstat lets administrators query and monitor I/O load. Because this level of functionality requires a special kernel option, older distributions will not support it. In fact, if you have Ubuntu, you will need at least Hardy, and openSUSE fans will need version 11 or a modified kernel to run the recently released version 8 of Sysstat by Sébastien Godard and the team of developers backing him up. |
Iostat, pidstat, mpstat, and the sar utilities provide information on system parameters, such as:
The information provided by the tools is typically grouped into the categories of memory, network, processors, CPU, and I/O. The pidstat options are as follows: -d outputs the I/O load, -r the pagefaults, -u the CPU usage, and -w the kernel's task-switching activity. Sar and iostat also include options for displaying data for network filesystems, and sar lets the administrator monitor TTY console use.
Unix diehards might complain that you can gather the same data with the use of internal Linux tools. Admins can use Awk to calculate the load average for any given period of time. All you need is some shell survival skills and the data from the proc filesystem (Figure 2). Although this is true, sar makes the task much simpler. The command
sar -q P0 120 2
gives you the queue length and load average. P0 specifies the CPU to monitor, and 120 2 tells sar to take two samples for a period of two minutes each, and then display the mean values for 1, 5, and 15 minutes. The output is shown in Figure 2.
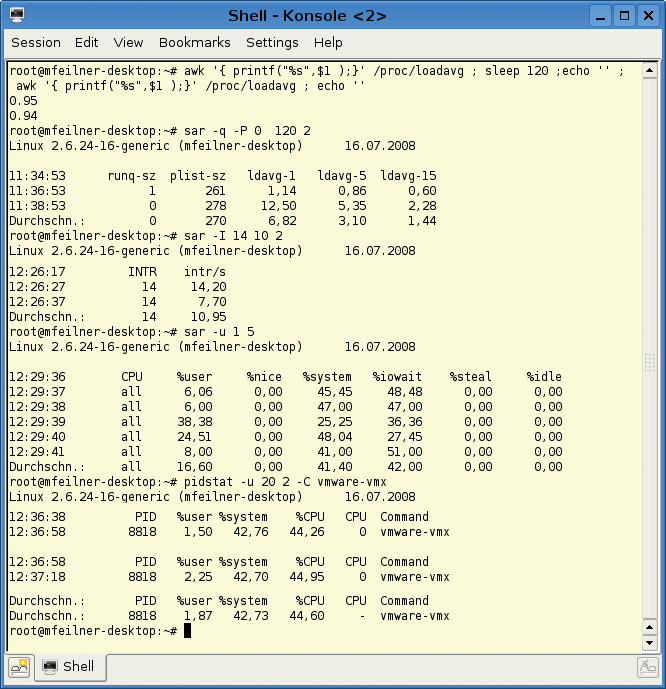
If inexplicable hardware problems occur, you can run
sar -I interrupt
to investigate individual interrupts. If the CPU load, which you can get by running sar -u, tells you that the server is working as hard as it can, this might not mean it is time to buy a new machine. Long-term monitoring might be preferable - options are available for both the console and the graphical front end.
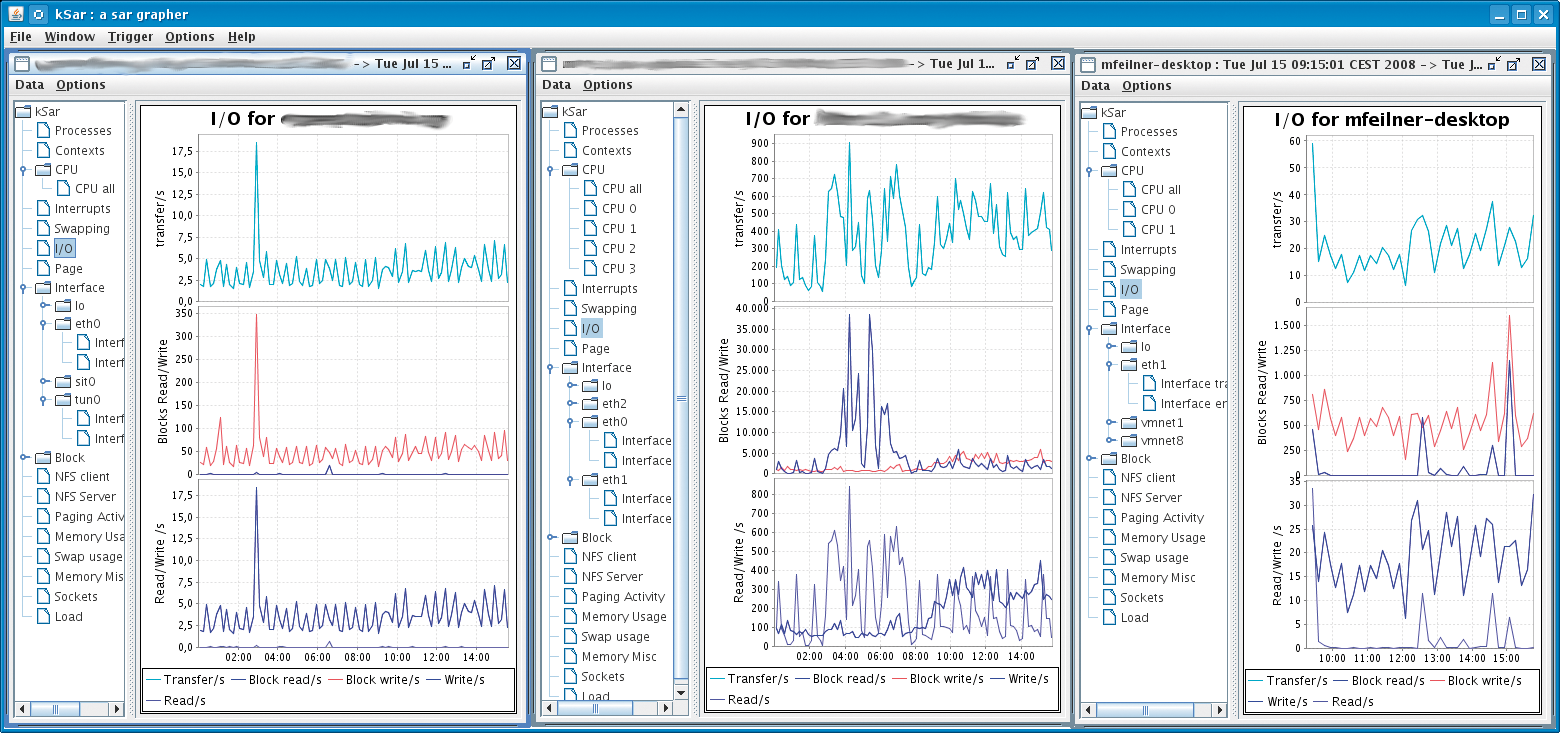
The kSar graphing tool is well suited to the task of graphing sar results. kSar gives you a fast overview of system performance and can even show you multiple servers at the same time with an SSH command (Figure 1). The Java tool will run sar -A on a remote server, receive a full set of sar data, and display the data for point and click navigation in a tree view. One really nice feature of kSar is that child windows are synchronized. Clicking on a sub-item in a tree diagram will automatically update the graphs for all the hosts currently shown. This feature is perfect for administrators wanting to compare multiple machines.
Bugs or loops in active programs often bring a server to its knees. Formerly, Linux admins had no alternative to time-consuming monitoring with Top, Strace, and other debugging tools, and that meant sitting in front of the screen. Today, one of the Sysstat tools makes this unnecessary. Pidstat creates statistics reports for individual Linux tasks. To monitor processes over extended periods of time, you can use pidstat and output the mean values.
The Sysstat developers describe how they even used pidstat to track down a memory hole in the Sysstat tools. If you use, say, pidstat -u 20 2 -C processname to monitor an individual process, the result is the average load for two requests within a period of 40 seconds (see Figure 2).
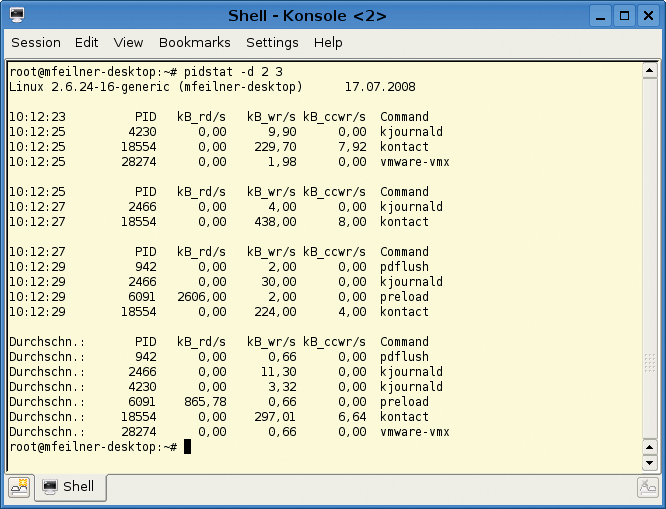
If you have kernel 2.6.20 or newer, with the CONFIG_TASK_IO_ACCOUNTING option built in, you can also use pidstat to monitor the I/O load for individual processes or whole groups. On a system with the right support, typing
pidstat -d 2 3
will generate output as shown in Figure 3. Pidstat will list the processes generating I/O and even tell you the type (read or write), along with the data throughput (in Kbps).
To allow this to happen, you need a recent kernel, the packages from the Sysstat website, and a matching cron configuration.
Listing 1 shows the /etc/cron.d/sysstat file on Ubuntu. In the simplest of all cases, the following two lines in /etc/crontab are all you need:
*/10 * * * * root /usr/lib/sa/sa1 1 1
53 23 * * * root /usr/lib/sa/sa2 -A
The first entry starts sadc (the System Activity Data Collector), the server daemon that collects data every second and stores its findings under /var/log/sa. The logfile format is saXX, where XX is the date. The second part with sar -A just rotates the logfiles.
| Listing 1: Cronjobs for Sysstat |
01 # Global variables:
02 #
03 # our configuration file
04 DEFAULT=/etc/default/sysstat
05 #  default setting, overriden in the above file
06 ENABLED=false
07 SA1_OPTIONS=""
08 # Activity reports every 10 minutes everyday
09 5-55/10 * * * * root [ -x /usr/lib/sysstat/sa1 ] && { [ -r "$DEFAULT" ] && . "$DEFAULT" ;
10 [ "$ENABLED" = "true" ] && exec /usr/lib/sysstat/sa1 $SA1_OPTIONS 1 1 ; }
11 # Additional run at 23:59 to rotate the statistics file
12 59 23 * * * root [ -x /usr/lib/sysstat/sa1 ] && { [ -r "$DEFAULT" ] && . "$DEFAULT" ; [
13 "$ENABLED" = "true" ] && exec /usr/lib/sysstat/sa1 $SA1_OPTIONS 60 2 ; }
|
Besides sar and pidstat, the Sysstat package also includes iostat and mpstat. Mpstat monitors the processor you pass in to it; iostat is popular with file, database, and mail server administrators as a tool for measuring system I/O load by drive, disk, partition, and filesystem.
For example,
iostat -m -n 10 2
monitors an NFS mount point and outputs the volume of data in megabytes (Listing 2). For a single partition, you can do the same by typing iostat -m -x sda2 10 2, as shown in Listing 3.
| Listing 2: NFS Mount Point Activity |
01 # iostat -m -n 10 2 02 Filesystem: rMB_nor/s wMB_nor/s rMB_dir/s wMB_dir/s rMB_svr/s wMB_svr/s rops/s wops/s 03 server:/home 0,03 0,01 0,00 0,00 0,01 0,02 6,53 6,53 04 05 Filesystem: rMB_nor/s wMB_nor/s rMB_dir/s wMB_dir/s rMB_svr/s wMB_svr/s rops/s wops/s 06 server:/home 6,65 6,64 0,00 0,00 6,65 0,81 252,40 252,40 07 # |
| Listing 3: I/O for a Partition |
01 # iostat -m -x sda2 10 2 02 avg-cpu: %user %nice %system %iowait %steal %idle 03 2,01 0,01 0,52 0,40 0,00 97,05 04 05 Device: rrqm/s wrqm/s r/s w/s rMB/s wMB/s avgrq-sz avgqu-sz await svctm %util 06 sda2 0,71 3,32 1,09 0,85 0,02 0,02 38,13 0,06 28,37 2,87 0,56 07 08 avg-cpu: %user %nice %system %iowait %steal %idle 09 6,14 0,00 0,81 0,33 0,00 92,71 10 11 Device: rrqm/s wrqm/s r/s w/s rMB/s wMB/s avgrq-sz avgqu-sz await svctm %util 12 sda2 0,00 12,80 0,00 7,40 0,00 0,08 21,95 0,03 4,27 1,14 0,84 13 # |
The latest version of the Sysstat package includes some new features that many administrators have been waiting for - above all, the ability to monitor I/O load per process. Linux had some catching up to do in this regard. It is a pity you can't use this feature on older servers or on enterprise distributions. It is questionable whether distributions will respond with matching kernels and packages in future releases.
If you can do without detailed I/O statistics, a combination of sar and kSar will give you a flexible and comprehensive interface that lets you monitor multiple servers at the same time.
Even if you don't have a full-fledged monitoring system, you will still be able to identify recurring bottlenecks and take steps to fix any performance issues before a system crash.
| INFO |
|
[1] Sysstat: http://pagesperso-orange.fr/sebastien.godard
[2] kSar: http://ksar.atomique.net |