
By Tim Chen, Alex Shi, and Yanmin Zhang
Over the past several years, the Linux Kernel Performance Project [1] has tracked the performance of Linux and tuned it for throughput and power efficiency on Intel platforms. This experience has given us some insights into the best tools and techniques for tuning Linux systems. In this article, we describe some of our favorite Linux performance utilities and provide a real-world example that shows how the Kernel Performance Project uses these tools to hunt down and solve a real Linux performance issue.
The first task in performance tuning is to identify any bottlenecks that might be slowing down system performance.
The most common bottlenecks occur in I/O, memory management, or the scheduler. Linux offers a suite of tools for examining system use and searching out bottlenecks. Some tools reveal the general health of the system, and other tools offer information about specific system components.
The vmstat utility offers a useful summary of overall system performance. Listing 1 shows vmstat data collected every two seconds for a CPU-intensive, multi-threaded Java workload. The first two columns (r, b) describe how many processes in the systems can be run if a CPU is available and how many are blocked. The presence of both blocked processes and idle time in the system is usually a sign of trouble.
| Listing 1: vmstat Output |
01 #vmstat 02 procs -----------memory---------- ---swap-- -----io---- --system-- -----cpu------ 03 r b swpd free buff cache si so bi bo in cs us sy id wa 04 7 0 34328 757464 2712 26416 0 0 0 0 12 616773 34 28 37 0 |
The next four columns under memory show how much memory space is used. Frequently swapping memory in and out of the disk swap space slows the system. The cache column gives the amount of memory used as a page cache. A bigger cache means more files cached in memory. The two columns under io, bi, and bo, indicate the number of blocks received and sent to block devices, respectively, which gives an idea of the level of disk activity. The two columns under system, in, and cs, reveal the number of interrupts and context switches.
If the interrupt rate is too high, you can use an interrupt utility, like sar, to help uncover the cause. The command sar -I XALL 10 1000 will break down the source of the interrupts every 10 seconds for 1000 seconds. A high number of context switches relative to the number of processes is undesirable because of flushing of cached data.
The next four columns in Listing 1, us, sy, id, and wa, indicate the percentage of time the CPU(s) has spent in userspace applications, in the kernel, being idle, or waiting for I/O, respectively. This output shows whether the CPUs are doing useful work or whether they are just idling or being blocked. A high percentage of time spent in the OS could indicate a non-optimal system call. Idle time for a fully loaded system could point to lock contentions.
Hdparm is a good tool for determining whether the disks are healthy and configured:
# hdparm -tT /dev/sda
/dev/sda:
Timing buffered disk reads: 184 MB in 3.02 seconds = 60.88 MB/sec
Timing cached reads: 11724 MB in 2.00 seconds = 5870.80 MB/sec
The preceding command displays the speed of reading through the buffer cache to the disk, with and without any prior caching of data. The uncached speed should be somewhat close to the raw speed of the disk. If this value is too low, you should check in your BIOS to see whether the disk mode is configured properly. Also, you could check the hard disk parameter setting for an IDE disk
# hdparm -I /dev/hda
or for a SCSI disk:
# sdparm /dev/sda
To study the health of a run-time workload's I/O, use iostat. For example, Listing 2 shows how to use iostat for dumping a workload. If %iowait is high, CPUs are idle and waiting for outstanding disk I/O requests. In that case, try modifying the workloads to use asynchronous I/O or dedicate a thread to file I/O so workload execution doesn't stop.
| Listing 2: iostat |
01 #iostat -x sda 1 02 avg-cpu: %user %nice %system %iowait %steal %idle 03 0.00 0.00 2.16 20.86 0.00 76.98 04 05 Device: rrqm/s wrqm/s r/s w/s rsec/s wsec/s avgrq-sz avgqu-sz await svctm %util 06 sda 17184.16 0.00 1222.77 0.00 147271.29 0.00 120.44 3.08 2.52 0.81 99.01 |
The other parameter to check is the number of queued I/O requests: avgqu-sz. This value should be less than 1 or disk I/O will significantly slow things down. The %util parameter also indicates the percentage of time the disk has requests and is a good indication of how busy the disk is.
One important way to identify a performance problem is to determine how the system is spending its CPU cycles. The oprofile utility can help you study the CPU to this end. Oprofile usually is enabled by default. If you compile your own kernel, then you need to make sure that the kernel configs CONFIG_OPROFILE=y and CONFIG_HAVE_OPROFILE=y are turned on.
The easiest way to invoke oprofile is with the oprofile GUI that wraps the command-line options. To do so, use oprofile 0.9.3 or later for an Intel Core 2 processor and install the oprofile-gui package. Now invoke
#oprof_start
to bring up the Start profiler screen with Setup and Configuration tabs (Figure 1). First, select the Configuration tab. If you want to profile the kernel, enter the location of the kernel image file (that is, the uncompressed vmlinux file if you compile the kernel from source). Now return to the Setup tab.
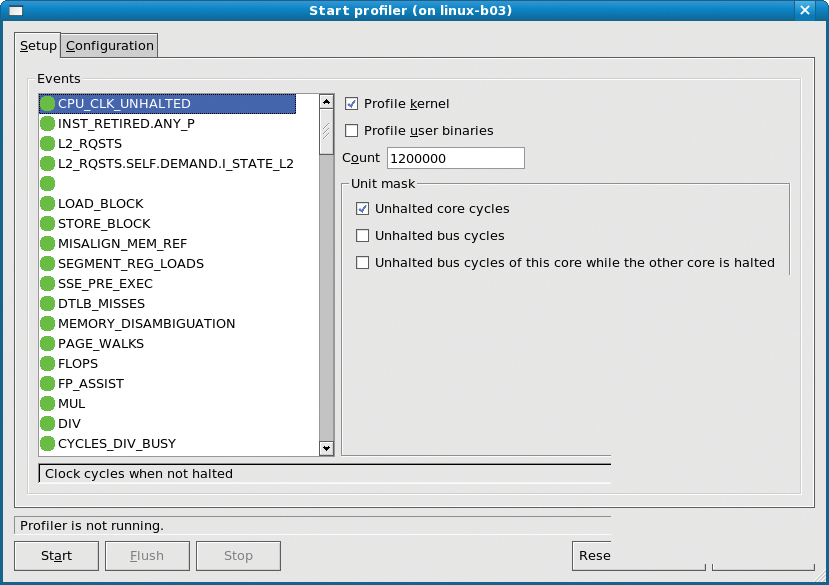
In the Events table, select the CPU_CLK_UNHALTED event and the unit mask Unhalted core cycles. Note: Normally, you do not need to sample the system any more often than the setting listed under in the Count field.
A lower count means that fewer events will need to happen before a sample is taken, thus increasing the sampling frequency. Now run the application you want to profile, and start oprofile by clicking on the Start button. When the application has stopped running, click the Stop button.
To view the profile data, invoke:
#opreport -l
The output for this command is shown in Listing 3.
Listing 3 shows the percentage of CPU time spent in each application or kernel, and it also shows the functions that are being executed. This report reveals the code the system is spending the most time in, which should improve performance if you can use this data as a basis for optimization.
| Listing 3: Viewing Profile Data with oprofile |
01 CPU: Core 2, speed 2400 MHz (estimated) 02 Counted CPU_CLK_UNHALTED events (Clock cycles when not halted) with a unit 03 mask of 0x00 (Unhalted core cycles) count 1200000 04 samples % app name symbol name 05 295397 63.6911 cc1 (no symbols) 06 22861 4.9291 vmlinux-2.6.25-rc9 clear_page_c 07 11382 2.4541 libc-2.5.so memset 08 10959 2.3629 genksyms yylex 09 9256 1.9957 libc-2.5.so _int_malloc 10 6076 1.3101 vmlinux-2.6.25-rc9 page_fault 11 5378 1.1596 libc-2.5.so memcpy 12 5178 1.1164 vmlinux-2.6.25-rc9 handle_mm_fault 13 3857 0.8316 genksyms yyparse 14 3822 0.8241 libc-2.5.so strlen 15 ... ... |
If you have collected call graph information, type the command
#opreport -c
to obtain the output shown in Listing 4.Listing 4 shows that this workload has some very heavy memory allocation activity associated with getting free memory pages and clearing them.
| Listing 4: opreport Output |
01 CPU: Core 2, speed 2400 MHz (estimated) 02 Counted CPU_CLK_UNHALTED events (Clock cycles when not halted) with a unit mask of 0x00 (Unhalted core cycles) count 1200000 03 samples % image name app name symbol name 04 ------------------------------------------------------------------------------- 05 295397 63.6911 cc1 cc1 (no symbols) 06 295397 100.000 cc1 cc1 (no symbols) [self] 07 ------------------------------------------------------------------------------- 08 1 0.0044 vmlinux-2.6.25-rc9 vmlinux-2.6.25-rc9 path_walk 09 2 0.0087 vmlinux-2.6.25-rc9 vmlinux-2.6.25-rc9 __alloc_pages 10 2 0.0087 vmlinux-2.6.25-rc9 vmlinux-2.6.25-rc9 mntput_no_expire 11 22922 99.9782 vmlinux-2.6.25-rc9 vmlinux-2.6.25-rc9 get_page_from_freelist 12 22861 4.9291 vmlinux-2.6.25-rc9 vmlinux-2.6.25-rc9 clear_page_c 13 22861 99.7121 vmlinux-2.6.25-rc9 vmlinux-2.6.25-rc9 clear_page_c [self] 14 36 0.1570 vmlinux-2.6.25-rc9 vmlinux-2.6.25-rc9 apic_timer_interrupt 15 24 0.1047 vmlinux-2.6.25-rc9 vmlinux-2.6.25-rc9 ret_from_intr 16 3 0.0131 vmlinux-2.6.25-rc9 vmlinux-2.6.25-rc9 smp_apic_timer_interrupt 17 2 0.0087 vmlinux-2.6.25-rc9 vmlinux-2.6.25-rc9 mntput_no_expire 18 1 0.0044 vmlinux-2.6.25-rc9 vmlinux-2.6.25-rc9 __link_path_walk 19 ------------------------------------------------------------------------------- 20 11382 2.4541 libc-2.5.so libc-2.5.so memset 21 11382 100.000 libc-2.5.so libc-2.5.so memset [self] 22 ------------------------------------------------------------------------------- 23 10959 2.3629 genksyms genksyms yylex 24 10959 100.000 genksyms genksyms yylex [self] 25 ... ... |
The performance of the system is highly dependent on the effectiveness of the cache. Any cache miss will degrade performance and lead to a CPU stall.
Sometimes a cache miss is caused by frequently used fields located in data structures that span across the cache line. Oprofile can diagnose this kind of problem.
Again, using the Intel Core 2 processor as an example, choose the event LLC_MISSES to profile all the L2 cache requests that miss the L2 cache. For the exact event to use, you should invoke opcontrol --list-events to read about the details of each event type available for your CPU.
Listing 5 shows how to call up a cache miss profile.
Oprofile is a very versatile tool. By carefully choosing which events to monitor, you can zero in on the CPU operation that is causing the problem.
| Listing 5: Cache Miss Profile |
01 #opreport -l 02 CPU: Core 2, speed 1801 MHz (estimated) 03 Counted L2_RQSTS events (number of L2 cache requests) with a unit mask of 0x41 04 (multiple flags) count 90050 05 samples % app name symbol name 06 2803 63.4163 cc1 (no symbols) 07 190 4.2986 vmlinux-2.6.25-rc9-ltop get_page_from_freelist 08 102 2.3077 as (no symbols) 09 60 1.3575 vmlinux-2.6.25-rc9-ltop __lock_acquire 10 53 1.1991 libc-2.7.so strcmp 11 39 0.8824 vmlinux-2.6.25-rc9-ltop unmap_vmas 12 38 0.8597 vmlinux-2.6.25-rc9-ltop list_del |
A high context switching rate, relative to the number of running processes, is undesirable and could indicate a lock contention problem. To determine the most contended locks, enable the lock statistics in the kernel, which will give you insight into what is causing the lock contention. To do so, use the lock_stat feature in 2.6.23 or later kernels. First, you'll need to recompile the kernel with the CONFIG_LOCK_STAT=y option. Then, before running the workloads, clear the statistics with:
#echo 0 > /proc/lock_stat
After running the workload, review the lock statistics with the following command:
#cat /proc/lock_stat
The output of the preceding command is a list of locks in the kernel sorted by the number of contentions. For each lock, you will see the number of contentions, as well as the shortest, maximum, and cumulative wait time for a contention. In addition, you will see the number of acquisitions, as well as the minimum, maximum, and cumulative hold times for a lock. The top call sites of the lock are also given to let you locate quickly where in the kernel the lock occurs.
It is worth noting that the lock statistics infrastructure incurs overhead. Once you have finished hunting for locks, you should disable this feature to maximize performance.
Program throughput that is inconsistent and sputters, applications that seem to go to sleep before coming alive, and a lot of processes under the blocked column in vmstat are often signs of latency in the system. LatencyTOP is a new tool that helps diagnose latency issues.
Starting with the 2.6.25 kernel, you can compile LatencyTOP support into the kernel by enabling the CONFIG_HAVE_LATENCYTOP_SUPPORT=y and CONFIG_LATENCYTOP=y options in the kernel configuration. After booting up the kernel with LatencyTOP capability, you can trace latency in the workload with a userspace latency tracing tool from the LatencyTOP website [2]. To start, compile the tool, do a make install of the LatencyTOP program, and run the following as root:
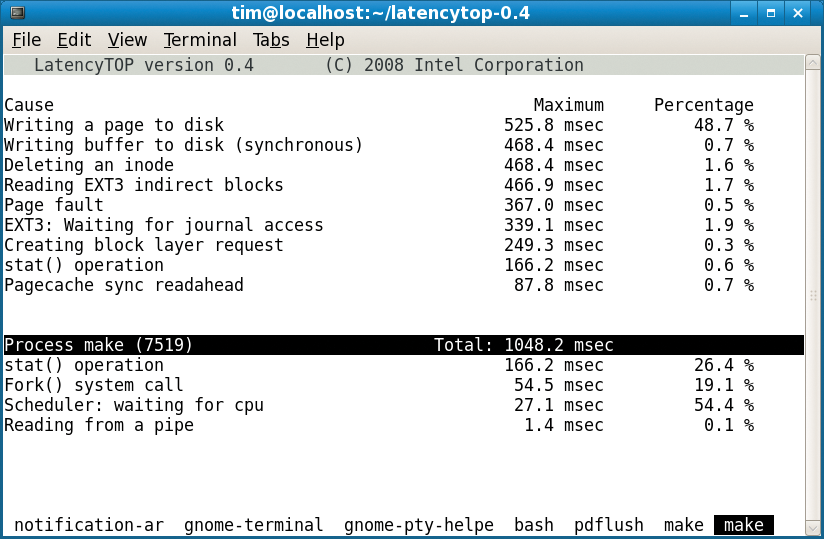
#./latencytop
The LatencyTOP program's top screen (Figure 2) provides a periodic dump of the top causes that lead to processes being blocked, sorted by the maximum blocked time for each cause. Also, you'll find information on the percentage of time a particular cause contributed to the total blocked time. The bottom screen provides similar information on a per-process basis.
Linux provides quick allocation and deallocation of frequently used objects in caches called "slabs." To provide better performance, Christopher Lameter introduced a new slabs manager called Slub.
However, we found that the scheduler performance benchmark known as hackbench reveals a big difference in run time with kernel 2.6.24/2.6.25-rc, between a system with 16 CPU cores and a system with eight CPU cores. Hackbench is expected to be faster on the 16-core system than on the 8-core system, but the testing result shows the first machine requires three times more run time than the second machine, which indicates a possible performance issue.
The vmstat utility provides the output shown in Listing 6.
| Listing 6: Starting with vmstat |
01 procs -----------memory---------- --swap--- ---io---- --system--- -----cpu----- 02 r b swpd free buff cache si so bi bo in cs us sy id wa st 03 360 0 0 15730644 17980 120336 0 0 0 0 320 140047 0 100 0 0 0 04 327 0 0 15739216 17980 120336 0 0 0 0 322 256259 1 99 0 0 0 05 412 0 0 15743084 17988 120336 0 0 0 16 282 74537 0 100 0 0 0 06 421 0 0 15741076 17988 120336 0 0 0 0 311 51750 0 100 0 0 0 07 334 0 0 15745048 17988 120332 0 0 0 0 295 95434 0 100 0 0 0 08 468 0 0 15747460 17988 120336 0 0 0 0 251 94440 0 100 0 0 0 09 373 0 0 15750844 17988 120336 0 0 0 0 268 104569 0 100 0 0 0 01 procs -----------memory---------- --swap--- ---io---- --system--- -----cpu----- 02 r b swpd free buff cache si so bi bo in cs us sy id wa st 03 360 0 0 15730644 17980 120336 0 0 0 0 320 140047 0 100 0 0 0 04 327 0 0 15739216 17980 120336 0 0 0 0 322 256259 1 99 0 0 0 05 412 0 0 15743084 17988 120336 0 0 0 16 282 74537 0 100 0 0 0 06 421 0 0 15741076 17988 120336 0 0 0 0 311 51750 0 100 0 0 0 07 334 0 0 15745048 17988 120332 0 0 0 0 295 95434 0 100 0 0 0 08 468 0 0 15747460 17988 120336 0 0 0 0 251 94440 0 100 0 0 0 09 373 0 0 15750844 17988 120336 0 0 0 0 268 104569 0 100 0 0 0 |
Notice the high context switch (cs) count and large number of running processes. In this case, hackbench simulates many chat rooms with a large number of users passing messages back and forth in each room. The lack of idle time in the system indicates that the CPU is very busy.
The next step is to use oprofile to find out where the CPU is spending its time. The oprofile data in Listing 7 shows that about 88% of the CPU time is spent in allocating slabs, adding to partially filled slabs, and freeing slabs. It shows that the benchmark generates lots of messages that are allocated and passed between processes and memory management, and that is where the program is spending the most time.
| Listing 7: Studying CPU Usage with oprofile |
01 CPU: Core 2, speed 1602 MHz (estimated) 02 Counted CPU_CLK_UNHALTED events (Clock cycles when not halted) with a unit mask of 0x00 (Unhalted core cycles) count 100000 03 samples % image name app name symbol name 04 46746994 43.3801 linux-2.6.25-rc4 linux-2.6.25-rc4 __slab_alloc 05 45986635 42.6745 linux-2.6.25-rc4 linux-2.6.25-rc4 add_partial 06 2577578 2.3919 linux-2.6.25-rc4 linux-2.6.25-rc4 __slab_free 07 1301644 1.2079 linux-2.6.25-rc4 linux-2.6.25-rc4 sock_alloc_send_skb 08 1185888 1.1005 linux-2.6.25-rc4 linux-2.6.25-rc4 copy_user_generic_string 09 969847 0.9000 linux-2.6.25-rc4 linux-2.6.25-rc4 unix_stream_recvmsg 10 806665 0.7486 linux-2.6.25-rc4 linux-2.6.25-rc4 kmem_cache_alloc 11 731059 0.6784 linux-2.6.25-rc4 linux-2.6.25-rc4 unix_stream_sendmsg |
This result indicates the need to take a closer look at what is going on with the slabs. A utility called slabinfo provides a report on slab activity. (The source code for the slabinfo utility is with the kernel source under Documents/vm/slabinfo.c.) To obtain information about the most actively used objects, invoke the slabinfo utility (see Listing 8).
| Listing 8: slabinfo |
01 #slabinfo -AD 02 Name Objects Alloc Free %Fast 03 :0000192 3428 80093958 80090708 92 8 04 :0000512 374 80016030 80015715 68 7 05 vm_area_struct 2875 224524 221868 94 20 06 :0000064 12408 134273 122227 98 47 07 :0004096 24 127397 127395 99 98 08 :0000128 4596 57837 53432 97 48 09 dentry 15659 51402 35824 95 64 10 :0000016 4584 29327 27161 99 76 11 :0000080 12784 33674 21206 99 97 12 :0000096 2998 26264 23757 99 93 |
The block objects, size 192 and 512, are actively used by hackbench messages: One is for the socket buffer header and one is for the message body.
Basically, the SLUB implementation keeps a per-cpu cache for each slab type. When the kernel allocates an object, it checks the per-cpu cache first without locking. Such allocation is very fast and is called a fast path. If the per-cpu cache hasn't freed objects, the kernel allocates from shared pages with a lock, which is slow. A slow path means more lock contentions. The free procedure also has a fast path and a slow path. Because free uses a distributed lock (page lock) and the allocation process uses more exclusive locks, allocation by fast path is more important.
For these two objects, we noted that the free operation is quite slow; however, allocation is not fast, either. For example, for objects of size 512, only 68% of allocation is by fast path, and 7% of free is by fast path.
To reduce the slow path allocation, we could ask for a bigger sized slab to increase the per-cpu object cache. To increase the default max_order of 1 and min_objects of 32, we add slub_max_order=3 slub_min_objects=32 to the kernel boot command line. This increases the number of objects that must fit into one slab for an allocation to be successful, which will reduce the chance that the kernel allocates objects by slow path.
This step improved the throughput significantly, requiring just one tenth the time needed in the previous test. By extensive testing with different slub_min_objects settings, we found the correlation between slub_min_objects and the CPU number.
Mostly, we get the best result with slum_min_objects=cpu_number*2. If slum_min_objects is equal to a bigger value, the result doesn't provide much improvement.
At this point, we went back to the 8-core machine and did extensive testing to confirm our findings. After we discussed the problem with the SLUB maintainers, a patch that scales slub_min_objects, as a function of the number of CPU cores, was merged into the Linux kernel.
In this article, we provided a quick tour of some useful tools for diagnosing common performance issues. Of course, this brief introduction is not intended as a comprehensive description of the performance tuning craft, but it should provide you with a good starting point for discovering and fixing performance bottlenecks on your Linux systems.
| Power Performance |
|
Power consumption is another aspect of system performance. Most recent processors are equipped with processor performance states (P-states) and sleep states (C-states). If the system is not fully loaded, it is better to switch to a P-state that operates the processor at a lower frequency and voltage. If the processor is idle, the system should switch to a sleep state. To take advantage of these features, make sure the BIOS Speed Step and C-state features are enabled. To take advantage of the P-state feature in the CPU, you need to make sure that a suitable CPU frequency governor is enabled for the system. To see what governors are available, use: # cat /sys/devices/system/cpu/cpu0/cpufreq/scaling_available_governors ondemand userspace performance With the following command, you can determine the current governor: # cat /sys/devices/system/cpu/cpu0/cpufreq/scaling_governor The ondemand governor has the best power-saving characteristics and is typically recommended, whereas the performance governor will put the CPU at the maximum frequency and voltage. To switch to the ondemand governor, issue the following command: # echo ondemand > /sys/devices/system/cpu/cpu0/cpufreq/scaling_governor To take advantage of the CPU C-states, you need to enable the tickless idle feature in the kernel. The Linux kernel has a periodic timer tick that wakes up the CPU. This tick prevents the CPU from going into the sleep state. With the recent addition of the tickless idle, the Linux kernel removed this timer tick, which allows the CPU to sleep for a longer time in power-saving mode. If you compile your own kernel, you should enable the option CONFIG_NO_HZ=y. The PowerTOP utility [3] is a useful tool for checking P-state and C-state status in the system. PowerTOP will show the current P-state and C-state, report on which applications wake up the CPU, and provide additional power-saving hints tailored to your system. Additional power-saving tips can be found at the Less Watts website [4]. |
| INFO |
|
[1] Linux Kernel Performance Project: http://kernel-perf.sourceforge.net
[2] LatencyTOP: http://www.latencytop.org/index.php [3] PowerTOP: http://www.lesswatts.org/projects/powertop [4] Less Watts: http://www.lesswatts.org/ |
| THE AUTHORS |
|
Tim Chen is a staff engineer of the Open Source Technology Center at Intel Corporation. His current focus is mainly on Linux performance. Before working at Intel, he worked at Trillium Digital Systems on telecommunications systems and at Hughes Space and Communications on mobile satellite systems. He graduated from UCLA in 1995 with a Ph.D. degree in Electrical Engineering. Alex Shi joined Intel's Open Source Technology as a software engineer in 2005. He works on Linux performance and power tuning. Yanmin Zhang, from Open Source Technology Center of Intel Corporation, has worked on Linux projects for five years, including processor and chipset enabling, which cover Intel i386, x86-64, and Itanium architectures and PCI-Express. He is currently working on the Linux Kernel Performance project. Before joining Intel, Yanmin worked for Bell Labs Lucent Technology on network management system development. |