
By Matthew Sacks
Hyperic HQ is an open source enterprise monitoring suite that includes all the essential features of an enterprise monitoring tool. What sets Hyperic apart from other open source suites is its ease of configuration and its focus on application layer performance metrics. Monitoring custom application servers, databases, and web servers is often a tedious task that requires a lot of custom retrofitting. Hyperic breaks the mold by letting you collect application-specific performance metrics automatically using a system of logical defaults.
The days of only monitoring system-level services and network connectivity are over. Hyperic belongs to a new breed of monitoring tools that can peer into complex application stacks. Hyperic HQ excels at monitoring applications and providing performance statistics for the most common application servers, database servers, web servers, network devices, and applications. Hyperic is an excellent choice for monitoring a Java application server, such as a JBoss server system.
| Developers |
|
Javier Soltero, Doug MacEachern, Ryan Morgan, Charles Lee, and John Sachs founded Hyperic in 2004 when they moved from Covalent. They created Hyperic HQ based on their prior work developing Covalent Application Manager, which they purchased from Covalent. Doug is one of the original developers for the mod_perl project and also a contributor to the Apache httpd project. |
Hyperic HQ monitors hosts with the use of an agent-based model; a Java-based agent is installed on target hosts that collect data and feed the information to a management server. Hyperic provides easy-to-configure installers for Linux, Windows, Mac OS X (PPC), and Solaris. Java 1.4+ is required for the management server and agents. Because Hyperic is a Java-based monitoring application, it can run on any platform that supports Java.
Hyperic provides the option of installing with a bundled Java Runtime Engine (JRE) to avoid having to download and instal a JRE or Java Development Kit (JDK), although you also have the option of using almost any JRE or JDK.
To start the easy installation, first download the HQ Installer [1], which provides the server, agent, and JRE required for a full Hyperic monitoring solution. Then select the installation package that most closely resembles the target system's operating system. If the system on which you are installing Hyperic is not listed on this page, choose Platform independent - no JRE and make sure a supported JRE/JDK is present on the target system.
Next, open a terminal as root and create a hyperic user and directory to deploy the server installation. Make sure that the hyperic user's home directory is owned by hyperic:
# mkdir /usr/local/hyperic
# useradd hyperic -d /usr/local/hyperic
# chown hyperic:hyperic /usr/local/hyperic
Now unzip the Hyperic installation tarball in /usr/local/hyperic:
$ tar -xvzf hyperic-hq-installer-4.0.2-939-x86-linux.tgz
Note that if you use the Hyperic tarball for the installation, you might need to add the init or rc scripts manually to start the Hyperic server or agents automatically at boot time.
The unzipping process creates a directory called hyperic-hq-installer in which the installation sources reside. Now you can cd to this directory and execute the setup shell script:
cd hyperic-hq-installer
./setup.sh
When the prompt asks you which portion of the Hyperic suite to install, choose the first option to install the server only. Later, the agent will be installed on a separate host. After you press Enter, the Hyperic installer will automatically configure the database, networking, and other configuration parameters required for the Hyperic server (Listing 1).
| Listing 1: Installing Hyperic |
01 Loading install configuration... 02 Install configuration loaded. 03 Preparing to install... 04 Validating server install configuration... 05 Checking server webapp port... 06 Checking server secure webapp port... 07 Checking server JRMP port... 08 Checking server JNP port... 09 Verifying admin user properties 10 Validating server DB configuration... 11 Installing the server... 12 Unpacking server to: /usr/local/hyperic/server-4.0.1... 13 Creating server configuration files... 14 Copying binaries and libraries to server installation... 15 Copying server configuration file... 16 Copying server control file... 17 Copying server binaries... 18 Copying server libs... 19 Setting up server database... |
| Target Host |
|
In this article, the target machine on which the agent is installed is intended to model the high-performance Linux and Java application servers you might find in a high-volume, high-traffic website. Specifications are:
|
Next, a prompt will ask you to run a tuning script, which sets up the proper shared memory settings to run the built-in Hyperic database. (Because the tuning script is not necessary for all operating systems, however, the prompt will only appear on systems that require the script.) To make sure the installer is not terminated, open another terminal window, run the tuning script as root in the new terminal window, return to the original installer terminal window, and press Enter to resume the installer once the script has executed.
Next, log in to another terminal as root and execute the script tune-os.sh:
/usr/local/hyperic/hyperic-hq-installer/installer-4.0.1/data/hqdb/tune-os.sh
After you run the script, press Enter to continue the installation. If all goes well, a message will tell you that the installation completed successfully.
Next, go to the /usr/local/hyperic/server-4.0.1/bin directory and run the command
/hq-server.sh start
to start your HQ server. When the HQ server starts up for the first time, it might take several minutes to initialize. Subsequent startups will be much faster.
Once the HQ server reports that it has started successfully, you can log in to your HQ server at http://10.10.1.22:7080/ with the following credentials:
username: hqadmin
password: hqadmin
To change your password, log in to the HQ server, click the Administration link, choose List Users, then click on the hqadmin user.
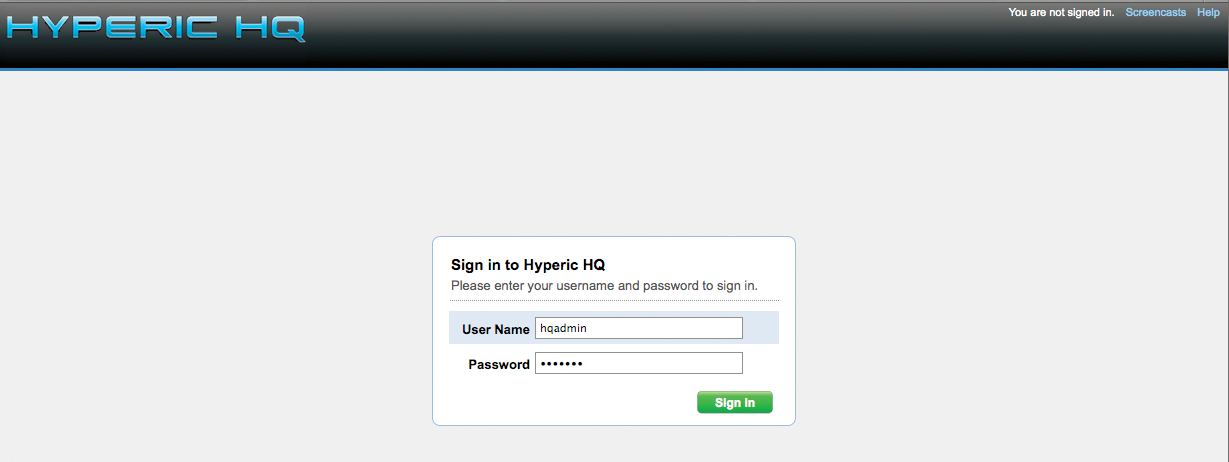
If you have any problems with the installation, you will find an installer log file at /usr/local/hyperic/hyperic-hq-installer/installer-4.0.1/./hq-install.log.After authentication to the web user interface (Figure 1), the HQ dashboard will appear. Notice that no hosts are being monitored because the agent is not yet installed on any of the nodes.
The agent can run on almost any machine that supports Java. Agents with easy-to-use installation packages are available for Windows, Mac OS X, Linux, and Solaris, and a platform-independent version, which comes bundled with or without a JRE, can run on any operating system that supports Java.
Either install the agent with the server installer by selecting installation option 2, or deploy a standalone installation to save disk space. The standalone agent and the server installation differ in size by 94MB, so if you are deploying a large number of nodes with a tool such as Cfengine [2], it is better to use the standalone agent installer.
First, download the HQ Agent installation package [1] for the operating system on which the agent will be deployed. If your OS is not listed on the download page, select Platform Independent and make sure a supported JRE is present on the system. For this, I selected the 32-bit Linux tarball installer, but I could have used the Red Hat RPM because the target is a Red Hat Linux server.
Next, open a terminal as root and create a hyperic user and directory to deploy the agent installation. The hyperic user's home directory should be owned by hyperic.
# mkdir /usr/local/hyperic
# useradd hyperic -d /usr/local/hyperic
# chown hyperic:hyperic /usr/local/hyperic
Now unzip the Hyperic agent installation tarball in /usr/local/hyperic
$ tar -xvzf hyperic-hq-agent-4.0.2-939-x86-linux.tgz
and change directory to the unzipped installation:
$ cd hyperic-hq-agent-4.0.2
The first time the agent is executed, it will prompt the user for various configuration parameters, such as the IP address of the management server, and it will generate a configuration file that is used the next time the agent is started. Most of the defaults can be accepted as is or changed according to the user's needs.
Now start the agent with the following command:
$ bin/hq-agent.sh start
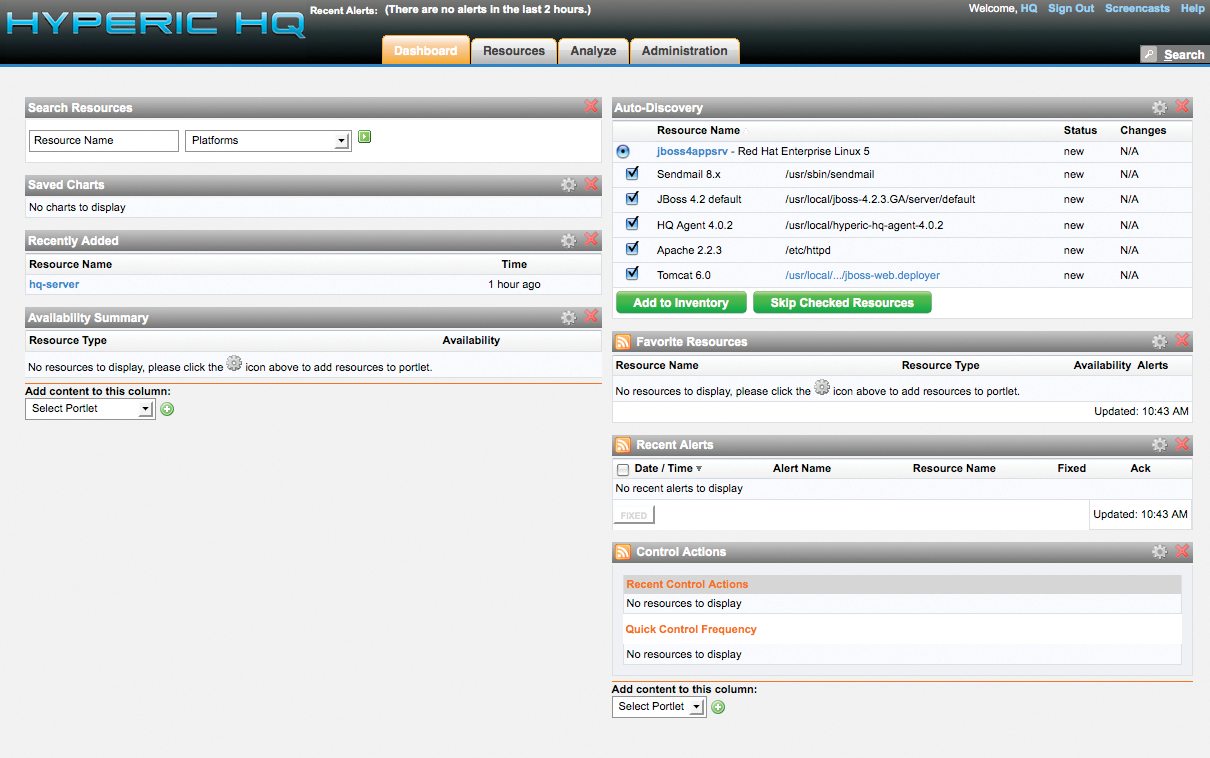
Provided the networking information is correct and no firewall rules are interfering with the communication between your server and agent, the agent should quickly sync up with the server (see Listing 2). Once the agent is installed on the host, its services should be detected by the auto-discovery process of Hyperic HQ (Figure 2).
The currently running servers and services on the target host are automatically detected and made available for the monitoring inventory. Just select the services you want to monitor and click Add to Inventory. The HQ Server will begin collecting performance and availability data from the target host.
Now you can view the host in the Recently Added section of the dashboard or by navigating to the top menubar and clicking Resources | Browse.
NOTE: Please make sure all servers are synchronized with an NTP server; otherwise, you might have some difficulties viewing the graphs on target systems because of NTP drift.
| Listing 2: The Agent Syncs with the Server |
01 Starting HQ Agent. . . 02 - Unable to load agent token file. Generating a new one . . . Done 03 [ Running agent setup ] 04 What is the HQ server IP address: 10.10.1.22 05 Should Agent communications to HQ always be secure [default=no]: 06 What is the HQ server port [default=7080] 07 Testing insecure connection . . . Success 08 What is your HQ login [default=hqadmin]: 09 What is your HQ password: 10 What IP should HQ use to contact the agent [default=10.10.1.23]: 11 What port should HQ use to contact the agent [default=2144]: 12 Received temporary auth token from agent 13 Registering agent with HQ 14 HQ gave us the following agent token 15 1230453862315-22390840293-39928390561937 16 Informing agent of new HQ server 17 Validating 18 Successfully setup agent |
Hyperic offers robust features for monitoring and managing many types of applications, but the tool provides special integration with enterprise Java applications and application servers.
When it comes to the enterprise, most system administrators need to go beyond the simple "service is up or down" monitoring of core services. The focus is instead on gathering complex metrics inside an application to understand how the infrastructure is performing. The next frontier is application monitoring. Most conventional monitoring solutions do not have the ability to poke inside the application or database without custom tools or scripts.
Hyperic has more than 70 built-in plugins for managing and monitoring various application servers, database servers, web servers, Xen servers [3], VMware ESX servers, and more. When configuring application and database servers such as WebLogic, JBoss [4], or Oracle Database and MySQL [5], it can become rather cumbersome to integrate trending of performance metrics into an all-in-one monitoring solution. Usually trending such application-specific metrics is a highly customized, manual process that requires custom scripting or writing proprietary tools.
Hyperic automatically collects the most common metrics of interest in almost all of the most popular database servers, application servers, middleware, and network equipment. Hyperic trends performance data for these types of applications and platforms, automating what is otherwise a time-consuming, high-overhead process.
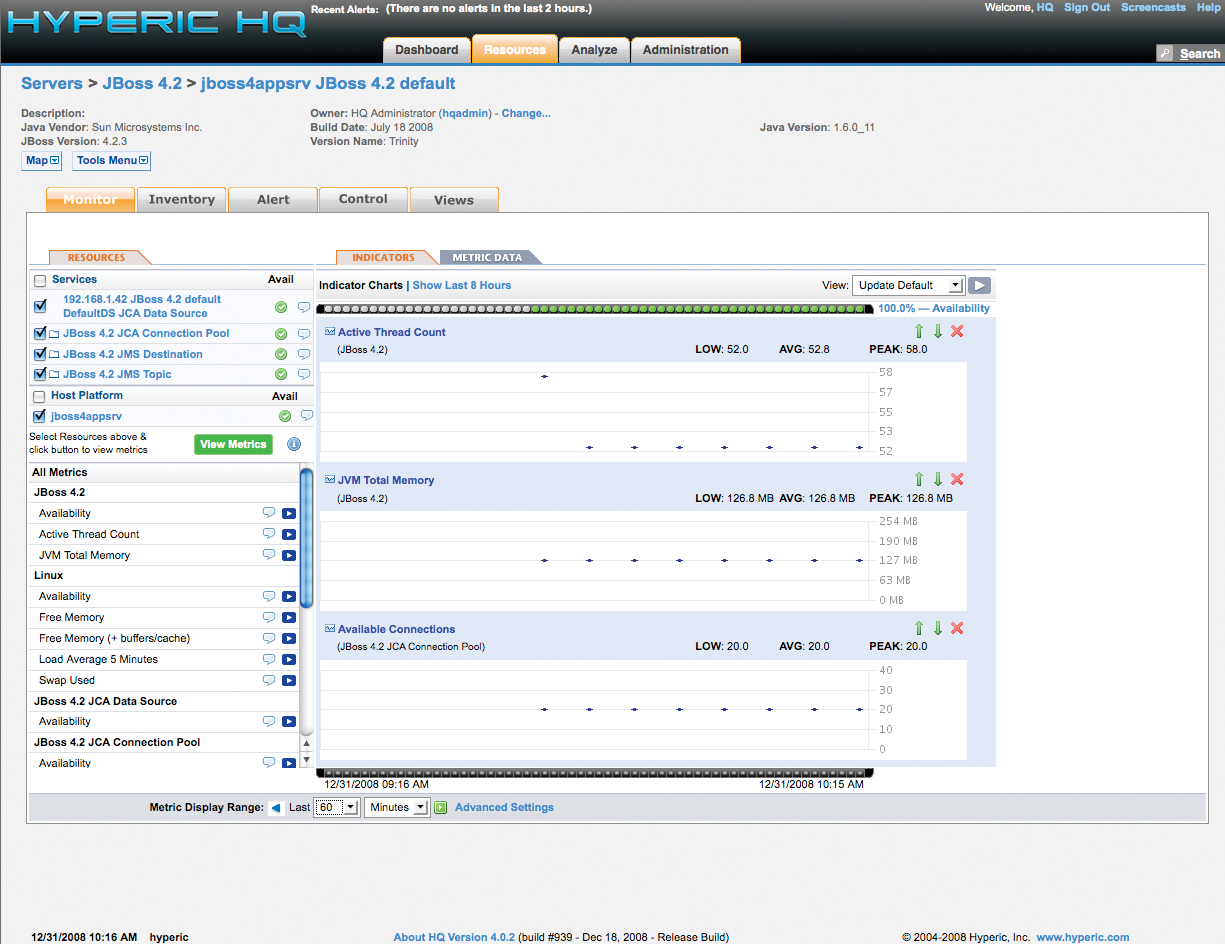
For example, if a JBoss application server is running on the target host, the HQ Agent will automatically discover the JBoss server and collect metrics such as transactions, JVM heap usage, thread count, hibernate statistics, and active connections (Figure 3). Hundreds more application metrics can be graphed, trended, reported, and alerted on, and each application's metrics are custom tailored to be relevant to the type of application. For example, when installing the HQ agent on a server running an Oracle or MySQL database, the application metrics show SQL statistics in addition to the other application metrics.
In addition to the default metrics available for the standard 70 officially supported application plugins, custom metrics can be developed and implemented for items not present in the system of logical defaults. The Hyperic website has a list of products and technologies that HQ can natively manage and trend.
For a closer look at Hyperic HQ in a real situation, consider the case of a JBoss Java application server. JBoss is an excellent choice for a Java Application Server platform; a free, open source community version of JBoss is available at http://www.jboss.org/jbossas/downloads/.
The first step in monitoring JBoss is to enable and configure the Java Management Extensions (JMX). JMX is a standard Java API that allows for default and custom monitoring of various attributes related to Java applications and the Java Virtual Machine.
The Sun JDK exposes certain MBeans to the user by passing the -Dcom.sun.management.jmxremote argument, which allows you to connect to the Java Virtual Machine's MBeanServer via JMX. This feature lets you access metrics from the JVM itself with Hyperic HQ or any other JMX client.
To access the JBoss MBean server through JMX, you need to pass some additional parameters to JBoss at startup. JBoss includes a start script to set all parameters that can be modified to include custom management arguments. The arguments can also be passed to the JVM on the command line, but it is better to keep them stored in a script.
To enable JMX remote connections and enable access to the JBoss MBeanServer, start by making a copy of $JBOSS_HOME/bin/run.sh to modify:
cp $JBOSS_HOME/bin/run.sh $JBOSS_HOME/bin/run-jmx.sh
Next, add an environment variable at the beginning of this run-jmx.sh script to set the custom JMX monitoring arguments (Listing 3). The JMX options that are specific to JBoss and the Sun JVM have been separated for modularity and put in the JAVA_OPTS argument, which is used by JBoss at start time.
| Listing 3: JBoss Startup Script |
01 #!/bin/sh 02 ### =========================== 03 ### 04 ## 05 ## JBoss Bootstrap Script 06 ## 07 ### ============================ 08 ### 09 10 ### $Id: run.sh 64199 2007-07-23 15:57:38Z cazzius $ ### 11 JBOSS_JMX="-Djavax.management.builder.initial=org.jboss.system.server.jmx.MBeanServerBuilderImpl -Djboss.platform.mbeanserver" 12 SUN_JMX=-Dcom.sun.management.jmxremote.port=5555 -Dcom.sun.management.jmxremote.authenticate=false -Dcom.sun.management.jmxremote.ssl=false" 13 JAVA_OPTS="$JBOSS_JMX $SUN_JMX" 14 15 ... |
Now set executable permissions
chmod 750 run-jmx.sh
and start JBoss with the -b <public IP address> option. Otherwise, JBoss will only bind to the localhost address and startup messages will be written to the console.
First make sure the network configuration is set up properly in the /etc/hosts file. Leaving this file as a default can cause problems with port bindings on the application server.
Once the message that follows is written to the console, the server will be up and ready for monitoring with JMX:
15:09:44,394 INFO [Server] JBoss (MX MicroKernel) [4.2.3.GA (build:
SVNTag=JBoss_4_2_3_GA date=200807181439)] Started in 9s:380ms
To discover automatically the JMX services of the Sun JVM, modify agent.properties to include this line:
jmx.sun.discover=true
If the agent is already running, the above line will require that you restart the agent, as in the following line:
/usr/local/hypric/agent-4.0.2/bin/hq-agent.sh restart
Now that JMX is enabled on the server and imported into Hyperic, a massive selection of monitoring and trending options is available. With the use of regular expressions on particular MBeans and attributes, you can create custom queries and then import them into the monitoring dashboard for trending over time. This strategy is especially helpful when monitoring custom applications that have their own custom JMX MBeans and attributes because Hyperic lets you centralize the monitoring with a standard interface. For more information on customizing and extending the Hyperic JMX plugin, see the Hyperic website.
Hyperic makes application metrics available with little to no configuration through the use of a system of logical defaults. Most application monitoring requires a special additional suite of software, which can be tedious to implement. On the other hand, Hyperic HQ out of the box can collect the most relevant performance and service metrics for the most commonly used software and do so with little to no need for manual configuration.
| Monitoring Best Practices |
|
A best practice is to monitor only the services and applications that are of importance to the administrator; otherwise, the data becomes less effective under the weight of irrelevant information. Also, make sure you establish a strategic alerting and escalation policy by configuring alerts that meet multiple conditions. This approach will prevent unnecessary 3am wake-up calls alerting you to a single server that is out of disk space on /tmp. Keep your alerts from "crying wolf." It takes a significant amount of time and tuning to get a proper monitoring policy that works. Often you'll need a period of at least one or two weeks to narrow down the proper alerting thresholds and identify what you need to monitor. My recommendation is to identify the critical business or organizational processes in order of priority and then map which IT infrastructure services support those processes. From there, you can draft and test a monitoring and alerting policy. In the first phase, alerting thresholds and monitoring metrics should be loose. Over the course of a week or so, identify any unnecessary items, and remove them one at a time. If the monitoring policy is targeted and well designed, the one or two week grace period provides a fairly simple and smooth transition. Starting with an open, noisy monitoring and alerting policy ensures that monitoring metrics and alerts that would normally be of interest are not accidentally filtered out. |
The primary difficulty in performance and enterprise monitoring is extending the solution into all of the particulars of a custom application, the database, and web servers that typically require a suite of expensive, proprietary monitoring tools. Hyperic brings a new era to enterprise monitoring by focusing on deep, application-specific performance metrics and making them virtually free of the need for configuration.
Hyperic HQ is supported by a community. In addition to the built-in support for more than 70 common products, other plugins for additional products and technologies are available from the HQ community site. The HQ server itself is open source, so anyone can modify and contribute to the code; however, most developers contribute to the project by creating plugins for new applications and new server types.
Hyperic HQ does an impressive job of application monitoring and removes the need to spend long hours scripting custom application-specific monitoring tools or to purchase expensive, third-party alternatives.
| INFO |
|
[1] Hyperic HQ installer: http://www.hyperic.com/downloads/index.html
[2] Cfengine: http://www.cfengine.org [3] Xen: http://www.xen.org [4] JBoss Community: http://www.jboss.org/ [5] MySQL: http://dev.mysql.com/ |
| THE AUTHOR |
|
Matthew Sacks is a system administrator and technical writer from Los Angeles, CA. He runs a technology blog, The Bitsource, at http://www.thebitsource.com. You may contact him at matthew@matthewsacks.com. |