By James Mohr
Nagios is a popular open source monitoring tool that helps you keep tabs on the status of hosts and services on your network. If all of your services are running fine, you are probably satisfied with the default display you are using now. However, if you have a large network, or if your network is prone to occasional, unexpected problems, you might be happier with a visual representation. A graphical rendering of your network offers a quick indication of where the problems in your network might be. In addition, managers often like pretty pictures and the convenience of a visual overview.
NagVis [1] is a helpful Nagios add-on that lets you visualize the systems on your network. The idea is that you create your own background images (called maps) and then embed icons on the images representing hosts and services on your network. Each icon displays the current status of the host or service it represents.
This simple yet flexible design lets you deploy NagVis in a number of useful ways. For example, you could create a geographical map of your server room and embed icons at the physical locations of the various servers. A map could also serve as a schematic view of a single-server computer with icons representing services running on the server.
NagVis even supports sub-maps, allowing for a very flexible representation of large networks. For instance, one map can represent a building, and sub-maps within it can represent rooms within that building.
A NagVis map is made up of a background image and a number of symbols representing services and hosts. In addition to the obvious benefits of seeing a map that represents the geography of the network, another useful way to implement NagVis maps is to create a diagram of your logical structure. For example, you could divide systems into groups on the basis of their functionality - such as, the front end, middleware, and databases.
A Nagios service or host is represented by an icon, and the icon changes its appearance according to its status. If a service is in a critical state, you'll get a quick warning about the problem just by noticing a change in the icon.
| Maps Only |
|
NagVis uses the Nagios user configuration file (/usr/local/nagios/etc/htpasswd.users) and thus the same access rules apply. However, you also have the option of specifying a different file with a different set of users - for example, ../share/nagvis/etc/.htaccess. In this way, it is possible to give specific users access to NagVis Maps without allowing them direct access to Nagios. |
NagVis is a PHP/AJAX application built on Nagios. In addition to Nagios itself, you'll need to make sure you have Nagios Data Out (NDO) and NDOutils installed on your system. (NagVis gets all of its status information from the NDO database.) For this article, I used Nagios version 3.0.6 and NDOutils 1.4b7. Also, I am assuming you have Nagios 3.x with NDO running and that you have a basic familiarity with both Nagios and NDO.
NagVis is a web-based application, so you'll also need a web server and at least PHP 4.2 or higher, as well as a number of other packages. (See the box titled "Packages Required for NagVis.") Note that NagVis does not need to be running on the same machine as Nagios. It would be possible, for example, to run a NagVis instance on an external web server and Nagios on an internal server. In one case, I even went so far as to provide NagVis access to customers without allowing access to the underlying Nagios instance.
| Packages Required for NagVis |
|
NagVis is typically provided as a gzipped tar archive, which you can download from SourceForge via the NagVis home page [1]. The file unpacks into a directory that is based on the version number (e.g., nagvis-1.3.2), which you'll move into the Nagios share directory and rename nagvis (e.g., /usr/local/nagios/share/nagvis). If you created an alias to this directory when you installed Nagios, you won't need to create a new alias for NagVis. All you need to do is set the permissions, as per the included INSTALL file
The etc directory, which can be found under the primary NagVis directory, contains a sample configuration file. The simplest approach is to copy the sample to nagvis.ini.php and then make the necessary changes. This file is built like a traditional Windows .ini file. Configuration blocks are defined by square brackets, and each entry has the format parameter =value. For example, the default global block looks like:
[global]
; select language (english,german,french,...)
language="english"
; dateformat of the time/dates shown in nagvis (For valid format see PHP docs)
;dateformat="Y-m-d H:i:s"
; show header (0/1)
;displayheader=1
; refresh time of pages
;refreshtime=60
Throughout the configuration file, you will notice that most of the parameters are commented out by default. NagVis is self-documenting, and you are given default values for the various parameters.
The parameters for the Nagios database are set in the block defining the so-called back end. A NagVis back end is simply a data source. The default back-end type, ndomy, which means Nagvis gets the data out of an NDO MySQL database, is the only option currently supported. Be sure to change the dbuser (user) and dbpass (password) parameters to the appropriate values. Although you can use the same user as Nagios, as long as the user can read the database, there is no problem creating a user specifically for NagVis.
By default, you have just one back end, defined as [backend_ndomy_1]; however, you can define more. Therefore, it is possible to display information from multiple Nagios instances on different machines. All you need to do is set the necessary parameters in the definition of the back end. Note that you must include backend_ in your definition in order for NagVis to recognize it.
If NagVis doesn't work at first and the on-screen error messages are not helpful, you will need to take a look in /var/log/messages. This file often provides additional information on the real cause of the problem. One of the most common problems is not being able to access the MySQL database, which is indicated by the error message "Could not open data sink!"
Once you install Nagios, you might notice that several default services are configured for the localhost (i.e., the machine on which Nagios is running). These services are well known, so when you get NagVis running, it will automatically recognize these services and display them accordingly.
At this point, you might be tempted to simply jump in and start configuring your map, but you are missing one key component: the background image.
The image you use does not need to be anything fancy. A simple line diagram will work, and any graphics tool that can save a PNG file will work fine. However, often the purpose of maps like this is to serve as eye candy for the managers, so you might want to consider making the map look a little fancier. Also, because you are likely to have these maps for a while, making them esthetically pleasing is not a bad idea. Once you have your image, copy it into ../nagvis/nagvis/images/maps. (Note that the double nagvis is correct.)
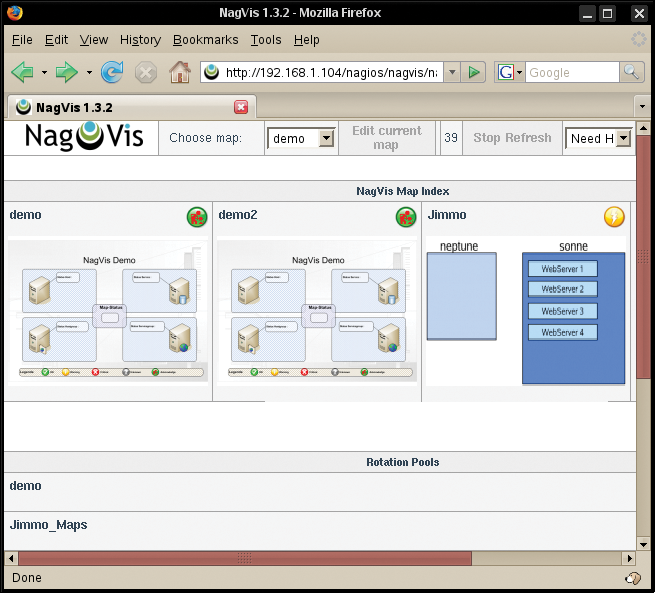
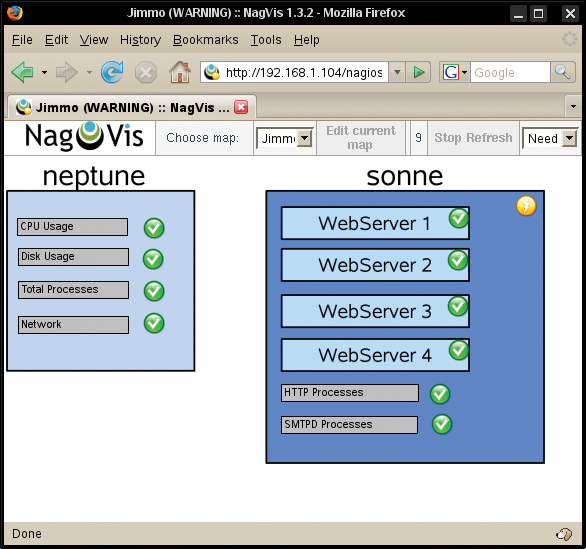
Start the configuration by pointing your browser to http://HOSTNAME/nagios/nagvis. This address brings you to the NagVis start page (Figure 1). If you click on one of the thumbnails, you arrive at the full-scale map (Figure 2). At any point, you can click Edit current map to get into edit mode. Then right-click the map to pop up a context menu. The first option, Open Map, opens the selected map in the NagVis editor. The option Open in NagVis opens the map in read-only mode. Options lets you configure the current map.
The Nagvis Configuration option is used to configure NagVis itself. Unless you have made changes directly to the configuration file, you will see that all the fields are empty in the default configuration.
| Hard States |
|
One useful aspect of NagVis is that it only reacts to hard states. That is, if a service has a short hiccup and is momentarily unavailable, you usually won't see the map change. If you would prefer to learn about all status changes, change the only_hard_states parameter to no when you configure the host. |
By selecting Manage | Maps from the popup menu, you can create a map or perform administrative functions like renaming or deleting an existing map. At the top of the form (Figure 3), you input the map name, then enter which users have read access (allowed_user) and which can change the map configuration (allowed_for_config). These users are the same users the web server recognizes, but NagVis does not do any checking at this point. Therefore, you need to be sure that the users are defined correctly.
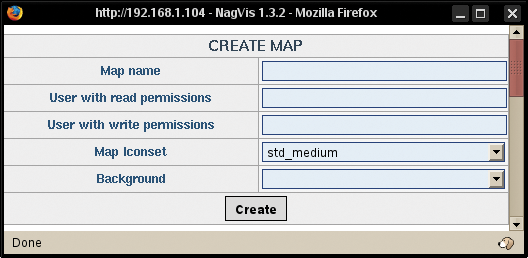
Note that you get a warning if you leave either of the User fields blank. By default, you should include at least nagiosadmin or the name you use for your primary Nagios administrator. If security is an issue, you can use a different user. Also, you can set this parameter to EVERYONE, without listing the users explicitly, so that every authenticated user can see the map.
Next, select the background image from the drop-down menu map_image. In this case, The image map you created earlier needs to already be present on the system. Keep in mind that NagVis does not scale images, so it is possible that your image looked fine in whatever application you used to create it, then ended up being too large on a particular monitor, forcing you to scroll to see all of it. If necessary, you can scale the image in an external graphics tool.
If you have several maps with a deep hierarchy, you can use the show_in_lists parameter to reduce clutter. A 0 setting prevents NagVis from displaying the map in the drop-down list or start page.
The Map Iconset field defines the set of icons used to display the status. By default, NagVis uses three sets of icons (big, medium, and small), which reside in ../nagvis/nagvis/images. If you want, you can edit the existing image to suit your needs or create your own set of new images. The set is configured for the entire map, but you can also elect to define an icon for individual services and hosts. For details on creating your own set, see the documentation on the Nagvis homepage [1].
When you are done, click Save to return to the Map Image window.
At this point, the map exists only as the background image, and you need to add the icons for your hosts and services. First, right-click the map and select Add Object, then Icon for a choice of Host, Service, Hostgroup, Servicegroup, and Map. The first four options are self-explanatory. The Map icon lets you create a link to a different map.
Linking different maps is useful for creating a map hierarchy of buildings, servers, and server cabinets. Also, you can define icons for host or services to link to a URL completely outside of NagVis and Nagios. For example, if you are monitoring the availability of a website, you could link to the site to verify the status.
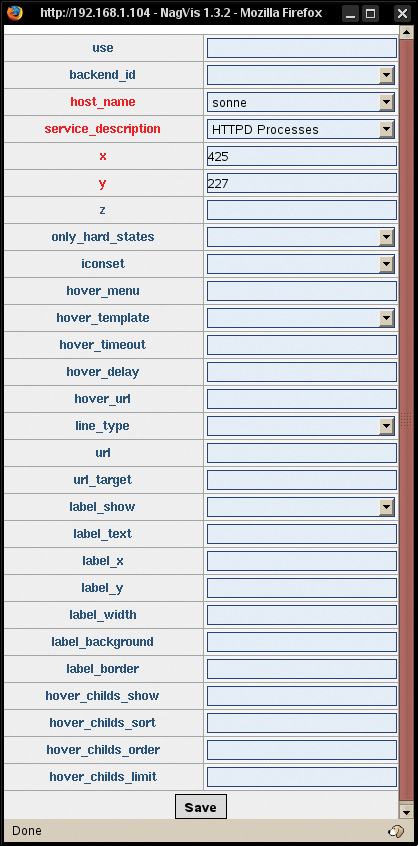
When you select the option to add an object, the cursor changes into a cross. Now you move the mouse and left-click on the location you want to place the icon. A pop-up window lets you input configuration information for the host or service you want to add.
Like Nagios, NagVis employs the use field to define configuration templates that are accessible to all services and hosts on the map. Then you only need to configure options that are different from the template.
When editing an icon, you do not necessarily need to click on it to make changes. If you mouse over an icon, a small window pops up in a couple of seconds with the icon's configuration and a link that allows you to change that configuration. If you prefer a hands-off approach, you can also configure icons to automatically display text rather than wait for a mouse-over event.
When configuring a host, NagVis only shows the status of the host itself by default. The recognize_services parameter tells NagVis to include the services on the given host. If you include both services and the host icon on a single map, this is probably not necessary. However, for higher level maps, it can be useful to combine this information.
Note that you are not limited just to individual services and hosts. NagVis supports both host groups and service groups, which appear in the configuration menu alongside hosts and services. Because hosts or services within a given group can have different priorities, Nagvis displays the status with the highest priority.
NagVis helps you visualize your Nagios environment with custom maps. Once your maps are set up with the basic configuration, you are ready to experiment with some more advanced options to see how they fit into your environment.
| INFO |
|
[1] NagVis: http://www.nagvis.org
|