
By Juliet Kemp
Strace is a useful little program - installed by default on most Linux systems - that allows you to take a look at the system calls used by an application. Don't be misled by the name: strace doesn't provide a stack trace - it just reports on system calls.
If you are having problems with a homegrown application - or with any application that offers you access to the source code - you can use strace to help determine where a program is crashing or what problems it is having. Even if you are not tracing a problem, strace is useful because it can help you find out more about what your system is doing, which can sometimes help with performance tuning and resource management.
In this article, I'll help you get started with strace by examining a pair of "Hello World" programs - one in Perl (a scripting language) and one in C (a compiled language). Next month, I'll cover some more advanced situations and take a deeper look into the strace output.
The basic strace command is:
strace program_name
However, this outputs everything straight to standard error (i.e., to the screen), and, as I'll show, there can be quite a lot of output. Thus, it's usually best to use the -o option to specify an output file:
strace -o outputfile.txt program_name
Some editors, such as vim, are able to do syntax highlighting of strace output. The syntax highlighting feature will display different parts of the file - and different parts of each line - in different colors. When you are trying to make sense of strace output, which can look a little confusing, this technique is particularly useful, and I strongly recommend you use an editor that offers syntax highlighting.
Consider the "Hello World" Perl script shown in Listing 1. In case you're not familiar with Perl, the first line tells the shell what program to use to run this script and, in this case, also sets the -w flag, which turns warnings on. The use strict statement turns the strict module on; use strict, which lets you see what output you get when loading a module, and -w are not really necessary in this script, but they are good habits. Finally, the last line prints the string "Hello, Perl!" with a newline at the end.
| Listing 1: helloworld.pl |
01 #!/usr/bin/perl -w 02 use strict; 03 print "Hello, Perl!\n"; |
After you've saved this script, change to the directory that it's in, make the script executable with chmod u+x helloworld.pl, and then, before you start looking at it with strace, run ./helloworld.pl to make sure the script contains no typos. Once you know the script is working, run strace on it with:
strace -o strace_perl.out ./helloworld.pl
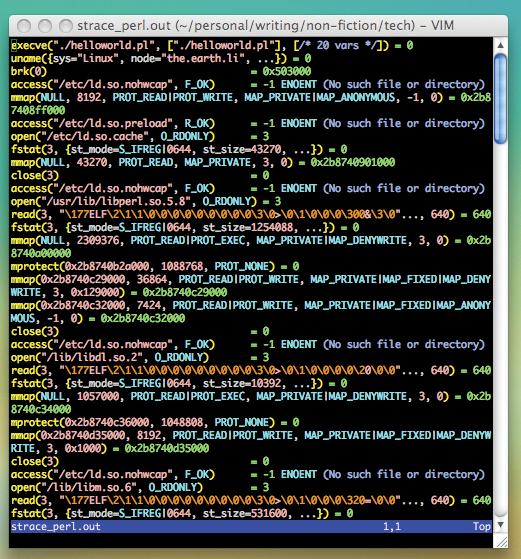
Next, open up the strace output file in an editor (Figure 1). The output might look a little intimidating, but don't worry about the details yet. Instead, look at the basic structure of each line. Strace outputs each system call as a single line, with the call name at the start of the line, its arguments in brackets, and the return value after the equals sign at the end of the line. Listing 2 shows the first lines of strace output.
| Listing 2: Example strace Output Lines |
01 execve("./helloworld.pl", ["./helloworld.pl"], [/* 20 vars */]) = 0
02 uname({sys="Linux", node="the.earth.li", ...}) = 0
|
In your Perl strace, you'll first see a line stating what script you're executing. The next line (Listing 2) is a call to uname, showing the details of your system. What uname actually returns is a pointer to the data structure; strace fills this information in for you. (By default, it only prints some of the information, but you can also request more detailed information.)
Whenever strace encounters a pointer to a data structure, it gives you the information pointed at rather than the pointer itself.
Next you'll see some access calls, which attempt to access information in specific files (see Listing 3). The access call shows what file the program is trying to access (e.g., /etc/ld.so.preload) and whether the attempt was successful. The -1 means unsuccessful, and the notice of failure is often accompanied with an error code (E *: or in this case, ENOENT). Then the error code is translated into plain English; ENOENT means "no such file or directory."
If the file does exist, access checks to see whether the program is allowed to access it (e.g., if the permissions are correctly set).
| Listing 3: Access Calls |
01 access("/etc/ld.so.preload", R_OK)      = -1 ENOENT (No such file or directory)
02 open("/etc/ld.so.cache", O_RDONLY)      = 3
03 fstat(3, {st_mode=S_IFREG|0644, st_size=43270, ...}) = 0
04 mmap(NULL, 43270, PROT_READ, MAP_PRIVATE, 3, 0) = 0x2b8740901000
05 close(3)                                = 0
|
As you might expect, open tries to open the specified file. If that file exists, the return value is a positive number. This file descriptor is the "handle" that the system will use to refer to this file for subsequent system calls. In the second article of this two-part series, I'll look at the fstat and mmap lines. After these lines, the file is closed again.
If you look at the open calls farther down the output, you'll see that some of the files are read from, as well. So what does this section mean? These are all files that are being loaded before the program can run, and they all have to do with the dynamic libraries used on a Linux system, which I'll discuss in more detail my next article. For now, it's enough to know that many of these files and libraries are loaded (or at least looked for) pretty much any time any file or program is executed on a Linux system. Also, you'll see a Perl library being loaded, which is obviously specific to Perl scripts.
Depending on your system and some memory-related and thread-related calls, you'll see some getuid and getgid calls after all the calls to libraries. These fetch the user and group ID that the process is running as (which should be your user ID), and the geteuid and geteguid calls fetch the effective user and group ID (i.e., this records who actually kicked the process off and whether they're running it as another user - which you might do, for example, if you used sudo).
Another couple of open calls are made to system directories, and then a series of stat calls, checking for the whereabouts of various Perl libraries or versions. Most of these will probably send back -1, which is the return you get if an error occurs. Perl libraries can be kept in a lot of places, and they all get looked through.
Finally, I get to the actual program (Listing 4)! The first line of Listing 4 searches for the executable. The /proc/self/exe is a symbolic link to the executable path; this data (in this case, the path /usr/bin/perl) is put in the buffer in the second argument. The return value is the number of bytes put into the buffer. In other words, I'm loading up the path to the executable.
| Listing 4: Running the Program |
01 readlink("/proc/self/exe", "/usr/bin/perl", 4095) = 13
02 getppid()                               = 3252
03 read(3, "#!/usr/bin/perl -w\n\nuse strict;\n"..., 4096) = 58
|
Then I get the process ID; on my system, it's 3252, but it will be something different on your system. Then, with the read line, the Perl script itself is read into memory. That second value is another example of strace doing some work for you. The second value in a read call is, again, a pointer to a buffer where the data that is read from the file descriptor is to be put.
The strace program dereferences the pointer and gets the data out of the buffer for you. In this case, the content of the buffer is your whole script (only the first few bytes are shown by default). The return value is the number of bytes read into the buffer. The next set of lines are all looking for the strict Perl module, and you'll see the output run through a set of possible locations (Listing 5).
| Listing 5: Looking for a Perl Module |
01 stat("/etc/perl/strict.pmc", 0x7fff6a1bdcb0) = -1 ENOENT (No such file or directory)
02 stat("/etc/perl/strict.pm", 0x7fff6a1bdb70) = -1 ENOENT (No such file or directory)
03 ...
04 stat("/usr/share/perl/5.8/strict.pm", {st_mode=S_IFREG|0644, st_size=599, ...}) = 0
|
After it finally gets a successful return for stat (i.e., a return value of 0 rather than -1), the module file is opened and read, as shown in Listing 6. Again, the return value of that open line - here, it's 4 - identifies the file for later calls.
Now look at the next few lines - the first argument for all of them is 4, which means they're looking at the /usr/share/perl/5.8/strict.pm file. The next few lines deal with seeking through the file, reading it, and then closing it again.
Finally, look at the last little section of the output (Listing 7). As before, that 3 is a file descriptor. If you look back through the output, you'll see that when the helloworld.pl file was opened, its return value (its descriptor) was 3.
| Listing 7: Last Part of Perl Output |
01 read(3, "", 4096) = 0 02 close(3) = 0 03 write(1, "Hello, Perl!\n", 13) = 13 04 exit_group(0) = ? 05 Process 3253 detached |
Again, I am reading the Perl file, but this time, the return value (remember, this is the number of bytes read into the buffer) is 0, and the second value (the data read in) is an empty string. In other words, this checks that everything really has been read out of the file before it's closed. Now the single actual command in the program is run in the write line, and the process is detached.
Right! That was fairly complicated, but I hope you have an idea of what's going on. Now I'll show you what happens and what differs when I do the same thing with a C file.
Listing 8 shows a "Hello World" program in C. To compile it, type cc -o helloworld helloworld.c and then check it by typing ./helloworld. Assuming all went well, you should run strace -o strace_c.out ./helloworld. The strace output is shown in Listing 9.
| Listing 8: helloworld.c |
01 #include<stdio.h>
02
03 main()
04 {
05     printf("Hello World");
06 }
|
| Listing 9: Complete strace for Hello in C |
01 execve("./helloworld", ["./helloworld"], [/* 20 vars */]) = 0
02 uname({sys="Linux", node="the.earth.li", ...}) = 0
03 brk(0)                                  = 0x501000
04 access("/etc/ld.so.nohwcap", F_OK)      = -1 ENOENT (No such file or directory)
05 mmap(NULL, 8192, PROT_READ|PROT_WRITE, MAP_PRIVATE|MAP_ANONYMOUS, -1, 0) = 0x2afb0be09000
06 access("/etc/ld.so.preload", R_OK)      = -1 ENOENT (No such file or directory)
07 open("/etc/ld.so.cache", O_RDONLY)      = 3
08 fstat(3, {st_mode=S_IFREG|0644, st_size=43270, ...}) = 0
09 mmap(NULL, 43270, PROT_READ, MAP_PRIVATE, 3, 0) = 0x2afb0be0b000
10 close(3)                                = 0
11 access("/etc/ld.so.nohwcap", F_OK)      = -1 ENOENT (No such file or directory)
12 open("/lib/libc.so.6", O_RDONLY)        = 3
13 read(3, "\177ELF\2\1\1\0\0\0\0\0\0\0\0\0\3\0>\0\1\0\0\0\200\305"..., 640) = 640
14 lseek(3, 624, SEEK_SET)                 = 624
15 read(3, "\4\0\0\0\20\0\0\0\1\0\0\0GNU\0\0\0\0\0\2\0\0\0\6\0\0\0"..., 32) = 32
16 fstat(3, {st_mode=S_IFREG|0755, st_size=1286104, ...}) = 0
17 mmap(NULL, 2344904, PROT_READ|PROT_EXEC, MAP_PRIVATE|MAP_DENYWRITE, 3, 0) = 0x2afb0bf0a000
18 mprotect(0x2afb0c02b000, 1161160, PROT_NONE) = 0
19 mmap(0x2afb0c12b000, 98304, PROT_READ|PROT_WRITE, MAP_PRIVATE|MAP_FIXED|MAP_DENYWRITE, 3, 0x121000) = 0x2afb0c12b000
20 mmap(0x2afb0c143000, 14280, PROT_READ|PROT_WRITE, MAP_PRIVATE|MAP_FIXED|MAP_ANONYMOUS, -1, 0) = 0x2afb0c143000
21 close(3)                                = 0
22 mmap(NULL, 4096, PROT_READ|PROT_WRITE, MAP_PRIVATE|MAP_ANONYMOUS, -1, 0) = 0x2afb0c147000
23 mprotect(0x2afb0c12b000, 86016, PROT_READ) = 0
24 arch_prctl(ARCH_SET_FS, 0x2afb0c1476d0) = 0
25 munmap(0x2afb0be0b000, 43270)           = 0
26 fstat(1, {st_mode=S_IFCHR|0620, st_rdev=makedev(136, 51), ...}) = 0
27 mmap(NULL, 4096, PROT_READ|PROT_WRITE, MAP_PRIVATE|MAP_ANONYMOUS, -1, 0) = 0x2afb0be0b000
28 write(1, "Hello World", 11)             = 11
29 munmap(0x2afb0be0b000, 4096)            = 0
30 exit_group(11)                          = ?
|
The first couple of lines look similar to the Perl example: an execve call containing the program name and a uname call. Also, a couple of access calls to the same files as before failed (ld.so.nohwcap and ld.so.preload). In addition, ld.so.cache is opened, read, and closed, as well. (ld.so.cache contains a list of possible libraries that have previously been found, which cuts down on the amount of time spent searching for libraries in the library path.)
Also present are the mmap, mprotect, and arch_prctl calls, as well as munmap. Because the program itself is the executable, and thus the permissions on it have already been checked, you won't see a check of the user or group ID. (With Perl, the executable is /usr/bin/perl - or wherever Perl lives on your system - so it is necessary to check to see whether the user has access to that executable file.)
Because C cleans up its memory after itself, munmap calls are also in the C strace output.
In this case, there's no readlink call because this is interpreted - not compiled - code, so you don't need to identify an executable with which to execute it. The difference between compiled and interpreted code is also responsible for the lack of read calls here compared with the Perl script output. The C code doesn't have to be read into memory and then fed into an interpreter; instead, it's run directly.
What you will see is the write line (Listing 10). In both the Perl and the C cases, what happens eventually is that a write call is made to output a string (the second argument in the method call) to the screen. In difference the case of Perl is that this is done via the interpreter, whereas in the case of C, it's the program itself that makes the call (but you can't tell this from the line, just from the context of it.)
| Listing 10: Write Line |
01 write(1, "Hello World", 11) = 11 |
Once again, there's an exit_group call, but this time it's called on the write call (value 11, in my example), rather than on the interpreter (value 0), as in the Perl case.
This quick introduction shows some basic information that you can learn from studying system calls with strace. Also, you might want to try strace out on a "Hello World" Bash script, or you could also try running strace on short commands such as cd or pwd.
| THE AUTHOR |
|
Juliet Kemp has been playing around with Linux ever since she found out that it was more fun than Finals revision and has been a sys admin for about five years. She finds strace output deeply fascinating, and had great fun delving into system call man pages while researching this article. |