
By Patricia Jung
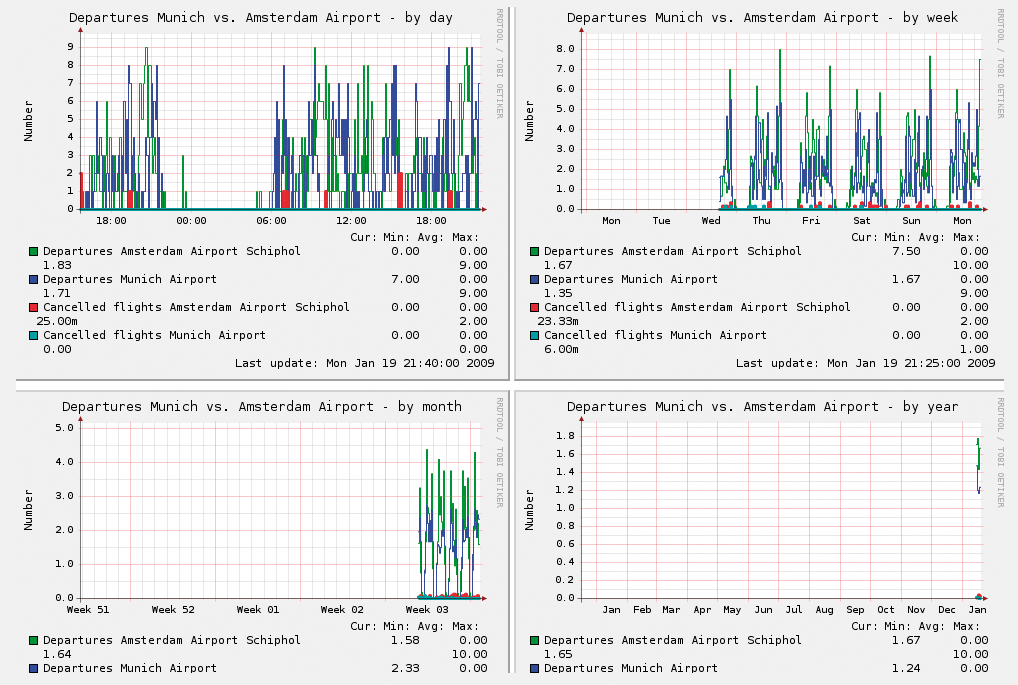
Graphs make numerical data more accessible; or, as Edward R. Tufte puts it: "Graphics reveal data." [1] The Munin monitoring application is known for drawing simple and practical graphs. This helpful tool, which is named for a mythical raven who delivers news to the Norse god Odin, collects, stores, and plots data in daily, weekly, monthly, and annual charts (Figure 1).
Munin, a GPLed monitoring tool originally developed by the Norwegian Linux service provider Linpro [2], receives data through a system of plugins tailored for various monitoring activities. A collection of useful plugins come pre-bundled with the Munin monitoring tool, and other plugins are available from third-party sources on the Internet. However, if you are faced with a monitoring task that other users haven't imagined yet, you might need to create your own plug-in. The very extensible Munin lets you create custom plugins for monitoring a wide range of activities. In this article, I'll explain how to build a plugin that monitors airport departures and arrivals.
Munin consists of three parts: plugins, the node, and the master. Munin plugins collect and extract the information you are monitoring, dump the data to STDOUT, and, when run with the config string as an argument, provide hints about how the data should appear.
A plugin can be a simple shell script or an elaborate compiled program. The fact that these plugins are complete scripts or programs in their own right (and not code snippets) makes it easy to test them before you deploy. Munin plugins can retrieve data from both local and remote sources. Plugins are run by a daemon dubbed the Munin node. The Munin node can trigger a plugin whenever it receives an appropriate request issued by the central Munin instance (known as the Munin master).
The Munin master consists of several scripts installed on a computer with a web server. These scripts are run by the cron daemon at five-minute intervals. The scripts retrieve data and presentation information from Munin nodes, store the information in round-robin databases (RRDs), and generate some nice graphs and simple web pages. The Munin master relies on RRDTool [3] for both data storage and graph generation.
The use of RRDs has a huge advantage: They are small and never change size, so you don't need a large disk or to watch your free disk space. The downside is that, after a short period of time, you will lose your older data.
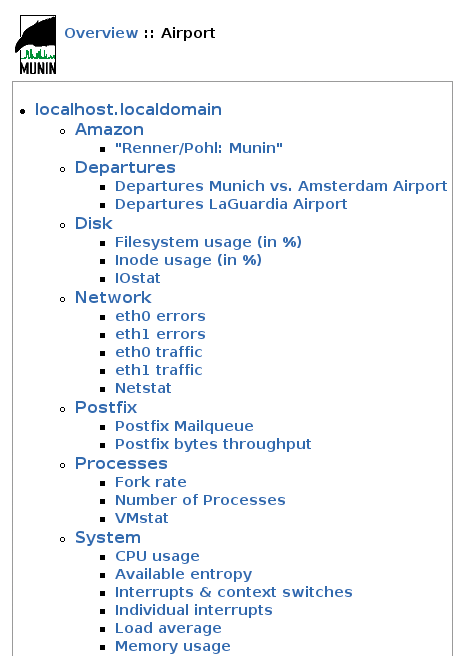
If you monitor many hosts, it might be difficult to find the host you're looking for in a hurry. Munin includes a means for classifying hosts into groups. For each group, the Munin master generates an additional, individual overview page (see Figure 2).
If you're using Fully Qualified Domain Names (FQDNs) in your configuration, Munin will automatically use the domain part on the name as a group. You might, however, want to define your own groups. Before you start monitoring, it might be a good idea to define and groups because the group name will define the directories in which the Munin master stores the graphs and data. If you want to reorganize later on, make sure you copy the relevant .rrd files to the new group directory within the five-minute interval between two Munin master runs; otherwise, Munin will start with empty RRDs in the new group folder.
The information about the hosts and groups is stored in the Munin master configuration file munin.conf (usually /etc/munin). Information in square brackets define the group and the hostname as they should be used on the Munin website:
[Airport;localhost.localdomain]
    address 127.0.0.1
    use_node_name yes
In this case, in addition to the general overview at http://localhost/munin/index.html, the Munin master will generate a group overview for a group dubbed "Airport" (Figure 2), which can be found on http://localhost/munin/Airport/index.html, and a host-specific page, http://localhost/munin/Airport/localhost.localdomain.html, presenting the by day and by week graphs for all relevant plugins.
If you decide to use your own group names, make sure you don't put any whitespace before and after the semicolon. If you are happy with Munin's default domain-based grouping, simply omit the group name and semicolon.
Note that the hostname given in square brackets does not necessarily denote the machine that runs the plugin. For example, if you want to monitor a router using an SNMP plugin, put the name of the router here, and set the use_node_name parameter to no. The Munin node that actually runs the plugin(s) is defined by the address parameter.
| Working with RRDs |
|
The RRDs used by Munin store the data of the past two days in five-minute intervals. Munin uses this data to generate by day diagrams (see Figure 1). Older values fall out of this database in order to make room for new information, but previous readings continue to contribute to the average values stored for longer periods. Munin's by week graphs are based on average data with a resolution of half an hour, which Munin stores for the past 10 days. The by month diagrams use a third RRD covering the past 46 days with a resolution of two hours; the by year graphs use an RRD covering the past 449 days with a resolution of one day. This means that Munin on its own does not allow you to compare, for example, annual sales graphs for the past four years or the monthly network throughput graphs for the past six months. But you can meet this requirement easily: Simply set up a cron job that files away the relevant graphs (and, if you like, the relevant RRD file) to a secure destination. On a Debian/Ubuntu system, you will find the PNGs under /var/www/munin/group_name/ and the RRDs under /var/lib/munin/group_name/. If you want to see the structure and content of a binary .rrd file, the rrdtool will help you: $ rrdtool dump file_name.rrd file_name.xml This command writes an editable XML file, which proves useful if plugins produce singular erroneous peak values. To convert the file back to the binary format, use the command: rrdtool restore file_name.xml file_name.rrd Note, however, that rrdtool restore never overwrites existing RRD files, and you only have a five-minute interval to manipulate the data. |
Periodically, you Munin master will contact port 4949 on all machines given as addresses. To ensure the master is allowed to do this, check the Munin node configuration file, munin-node.conf, on all node machines. If you run a Munin node daemon on the same machine that hosts your Munin master, don't be confused by the fact that your /etc/munin/ directory contains both the master configuration in munin.conf and the node configuration in munin-node.conf.
The node configuration file consists entirely of parameter-value pairs and comments (in /bin/sh syntax). The fact that master machines are allowed to contact port 4949 is given as a regular expression:
allow ^127\.0\.0\.1$
In this case, only the Munin master on localhost may contact this node. The connection uses the simple protocol shown in Listing 1.
| Listing 1: Demonstrating the Munin protocol |
01 $ telnet localhost 4949 02 Trying 127.0.0.1... 03 Connected to localhost.localdomain. 04 Escape character is '^]'. 05 # munin node at extrablatt.trish.de 06 list 07 open_inodes if_err_eth0 irqstats entropy processes postfix_mailqueue 08 if_eth0 airports df laguardia netstat interrupts swap load amazon_3937514481 09 cpu df_inode if_eth1 if_err_eth1 postfix_mailvolume forks iostat 10 open_files memory vmstat # munin node at extrablatt.trish.de 11 config airports 12 graph_title Departures Munich vs. Amsterdam Airport 13 graph_vlabel Number 14 graph_args --base 1000 --lower-limit 0 15 graph_category Departures 16 amsdeparting.label Departures Amsterdam Airport 17 amsdeparting.draw LINE1 18 mucdeparting.label Departures Munich Airport 19 mucdeparting.draw LINE1 20 amscancelled.label Cancelled flights Amsterdam Airport 21 amscancelled.draw LINE3 22 muccancelled.label Cancelled flights Munich Airport 23 muccancelled.draw LINE3 24 . 25 fetch airports 26 mucdeparting.value 1232367300:3 27 muccancelled.value 1232367300:0 28 amsdeparting.value 1232367300:2 29 amscancelled.value 1232367300:0 30 . 31 quit 32 Connection closed by foreign host. |
The Munin node replies to the list command with a list of all plugins that are configured to run on this node. As you can see, one of the plugins is a custom script that compares departures at the Munich and Amsterdam airports.
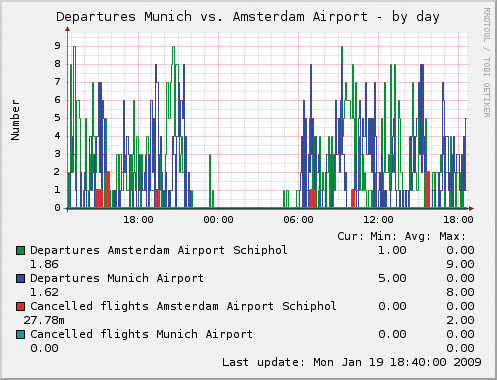
Using the config command, the Munin master asks the node to run a plugin with the config argument. Listing 1 does the same for the airports plugin. The node replies with a lot of parameters that the plugin uses to define how the data should be presented. For example, the graph is supposed to show the title Departures Munich vs. Amsterdam Airport, and the legend should feature four entries: Departures Amsterdam Airport, Departures Munich Airport, Canceled flights Amsterdam Airport, and Canceled flights Munich Airport (see Figure 1).
Finally, the fetch command asks the node to run the specified plugin without any arguments. The airports plugin monitors four parameters: mucdeparting (the number of current departures in Munich: three), muccanceled (the number of canceled flights in Munich that were scheduled for the effective time interval: zero), amsdeparting (Amsterdam departures: two), and amscanceled (canceled flights in Amsterdam: zero). 1232367300 denotes the time in seconds (since 1970-01-01 00:00:00 UTC) at which the plugin retrieved its data. Most plugins omit this information (together with the delimiting colon).
The quit command closes the connection to the node. If you are talking to the node by hand, you have to be fast to issue a config or fetch command. Otherwise, the node daemon will close the connection after 10 seconds of idle time. You can change this timeout by adding the following line to munin-node.conf:
timeout 20
This setting gives you a 20-second window to type in your commands.
Why does Listing 2 contain a plugin dubbed if_, which is used already? Although this plugin is in use, it can be activated several times. Plugins that end with an underscore are wildcard plugins. if_ is a standard plugin that monitors network traffic. But network traffic can go over several devices: (eth0, eth1, ...). In this case, you don't want to hardcode the network interface in the plugin code. Instead, this one plugin should be able to monitor all your network devices separately. At this point, it becomes clear why it is really clever to symlink plugins in order to activate them: To monitor eth0 and eth1, you don't need to copy the if_ plugin; just add the interface to the link name (Listing 3).
| Outfitting your Node |
|
If you installed your Munin node from a distributor's package, some plugins will already be active. These plugins will answer yes if run with the autoconf argument, indicating that all prerequisites have been met. Otherwise, a message will point out any obstacles: $ /usr/share/munin/plugins/apache_accesses autoconf no (no apache server-status or ExtendedStatus missing on ports 80) Most plugins included with the Munin distribution implement autoconf and include some so-called magic markers [5] in the code, indicating that they can be auto-configured using the munin-node-configure script. munin-node-configure --suggest lists auto-configurable plugins, which (hopefully) will give you some additional hints that a script might not be working (Listing 2). Note that this list is much shorter than the plain munin-node-configure listing, as it excludes all plugins that can't be enabled anymore. The Suggestion column contains a yes for plugins that meet the preconditions. munin-node-configure --shell tells you how to enable these plugins: $ munin-node-configure --shell ln -s /usr/share/munin/plugins/cupsys_pages /etc/munin/plugins/cupsys_pages To enable a plugin, link it to the /etc/munin/plugins/ directory: # ln -s /usr/share/munin/plugins/cupsys_pages /etc/munin/plugins/cupsys_pages # munin-node-configure | grep cupsys cupsys_pages | yes | Note that munin-node-configure --suggest now no longer lists cupsys_pages. In addition to the symlink, you also have to restart the Munin daemon: # /etc/init.d/munin-node restart |
| Listing 2: Why Don't My Plugins Work? |
01 $ munin-node-configure --suggest 02 Plugin | Used | Suggestions 03 ------ | ---- | ----------- 04 acpi | no | [thermal not supported by ACPI] 05 apache_accesses | no | [no apache server-status or ExtendedStatus missing on ports 80] 06 [...] 07 cupsys_pages | no | yes 08 [...] 09 if_ | yes | 10 [...] |
| Listing 3: Adding the Interface |
01 $ ls -al /etc/munin/plugins/if_eth* 02 lrwxrwxrwx 1 root root 28 2008-06-27 23:53 /etc/munin/plugins/if_eth0 -> /usr/share/munin/plugins/if_ 03 lrwxrwxrwx 1 root root 28 2008-06-27 23:53 /etc/munin/plugins/if_eth1 -> /usr/share/munin/plugins/if_ |
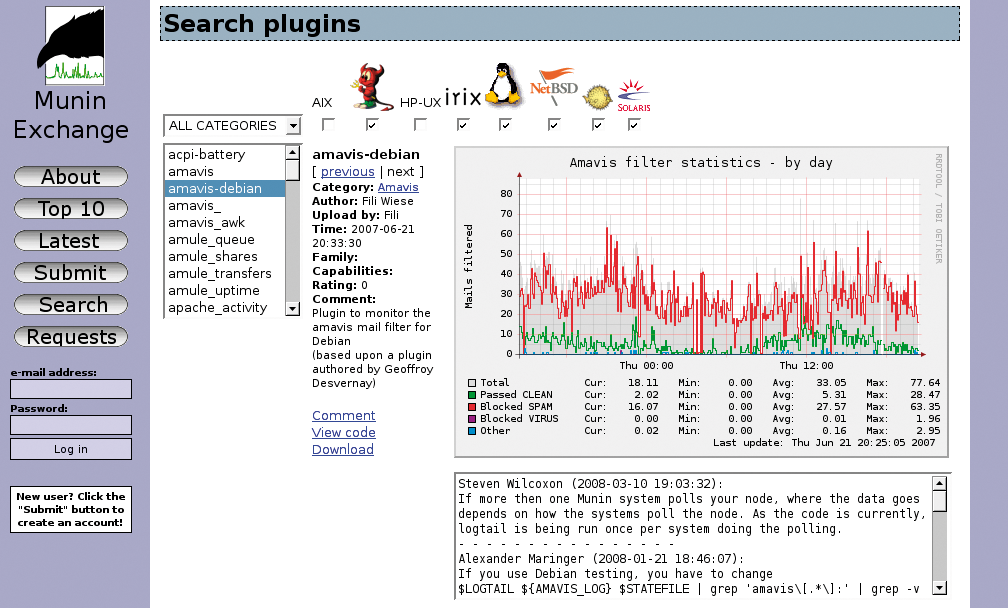
If you want to monitor parameters that aren't accessible through the available plugins, check out MuninExchange [5] (Figure 3), where you will find a collection of third-party plugins.
If you decide to write your own plugin, start simple. You can add extra effects later, after you get the basic system working. All you need at the first instance is a little program that issues a parameter.value value line on standard output for every parameter you want to include in the diagram. Additionally, when it is run with the config argument, this plugin should provide some hints about the title of the diagram, the labels, and other settings.
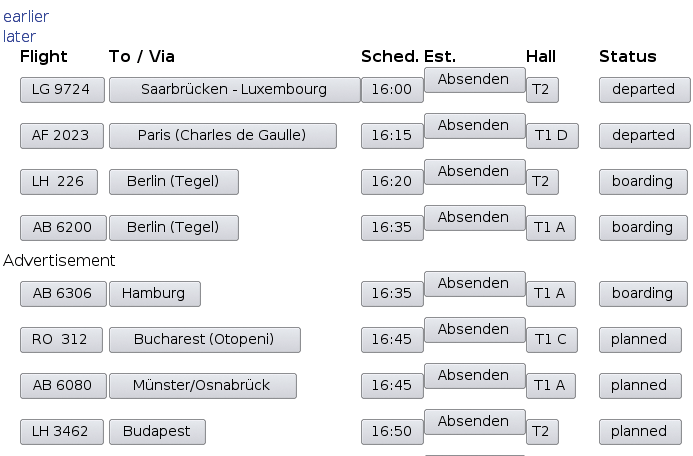
You needn't limit your plugin to standard system administration parameters. As long as the input data is available in some suitable electronic form, you can put Munin to work on almost any monitoring task. Listing 4 gives an example of a little shell script dubbed airports that counts the number of departures and canceled flights from Munich and Amsterdam Airports in five-minute intervals. The plugin obtains the relevant information from the departure timetables the two airports publish online (Figures 4 and 5). As it happens, both airports schedule flights in exactly the five-minute intervals Munin uses, which further simplifies the script.

| Listing 4: Airports Plugin |
01 #!/bin/sh
02
03 MUC_FILE=/tmp/.muc_flights
04 AMS_FILE=/tmp/.ams_flights
05
06 if test "$1" = "config"; then
07     echo graph_title Departures Munich vs. Amsterdam Airport
08     echo graph_vlabel Number
09     echo graph_args --base 1000 --lower-limit 0
10     echo graph_category Departures
11     echo amsdeparting.label Departures Amsterdam Airport
12     echo amsdeparting.draw LINE1
13     echo mucdeparting.label Departures Munich Airport
14     echo mucdeparting.draw LINE1
15     echo amscancelled.label Cancelled flights Amsterdam Airport
16     echo amscancelled.draw LINE3
17     echo muccancelled.label Cancelled flights Munich Airport
18     echo muccancelled.draw LINE3
19 else
20     TIME=$(date +%H)
21     MIN=$(echo "($(date +%M)/5)*5"|bc)
22     DATE=$(date +%Y-%m-%d)
23     DEP_MUC=http://www.munich-airport.de/en/consumer/fluginfo/abflug/index.jsp?viewType=t
24     DEP_AMS=http://www.schiphol.nl/Flightinfo/DepartureTimes/DepartureTimes.htm?s_date=$DATE\&s_time=$TIME%3A
25     case $MIN in
26         0) TIME=$TIME:00
27            DEP_AMS=${DEP_AMS}00;;
28         5) TIME=$TIME:05
29            DEP_AMS=${DEP_AMS}05;;
30         *) TIME=$TIME:$MIN
31            DEP_AMS=$DEP_AMS$MIN;;
32     esac
33
34     MUC_FILE=$MUC_FILE:$TIME
35     links -dump $DEP_MUC | grep $TIME > $MUC_FILE
36     AMS_FILE=$AMS_FILE:$TIME
37     links -dump $DEP_AMS | cut -c 1-46 | grep $TIME > $AMS_FILE
38
39     UNIXTIME=$(date -d$TIME:00 +%s)
40     echo "mucdeparting.value $UNIXTIME:$(egrep "calling|boarding|departed" $MUC_FILE | wc -l)"
41     echo "muccancelled.value $UNIXTIME:$(grep cancelled $MUC_FILE | wc -l)"
42     echo "amsdeparting.value $UNIXTIME:$(egrep "Boarding|Departed|Gate closing|Delayed" \
43     $AMS_FILE | cut -c19-46 | sort | uniq | wc -l)"
44     echo "amscancelled.value $UNIXTIME:$(grep Cancelled $AMS_FILE | cut -c19-46 | sort | uniq | wc -l)"
45
46     rm $MUC_FILE $AMS_FILE
47 fi
|
Despite the fortunate similarity in reporting intervals, you can't be certain the data the plugin delivers will synchronize perfectly with the exact five-minute steps used by Munin. Adding still more confusion, RRDTool interpolates by default. If data scheduled for a certain point in time enters the RRD with even a small delay, the tool will re-calculate the value at the recording interval using previously entered data.
For this reason, RRD rarely contains integer values - even though the airport timetables use five-minute departure slots. The good news is that RRDTool stores values prefixed with a colon and the Unix time in seconds (since 1970-01-01 00:00:00 UTC, as seen in Listing 1) in the slot for the given time, even if it receives the values later. The bad news is that you need at least Munin version 1.3.4 for this to work. If you are using an (unpatched) older version, plugins are not allowed to prefix the values with a timestamp, and you have to live with the interpolated data RRDTool produces.
To calculate the current five-minute interval, the plugin obtains the current minutes using date +%M. Then the script performs an integer division by 5 using bc and multiplies the result with 5 (echo "($(date +%M)/5)*5"|bc). The result is a two-digit integer value for 10, 15, 20, ... 55 minutes past the hour. In the case of zero or five minutes past the hour, the value has only one digit, so the script prefixes this value with a 0, as shown in the case statement. Combining this interval with the current hour (date +%H) and date (date +%Y-%m-%d) provides sufficient information for TIME to look up the flight status in the timetable. The the suitable URL for the Amsterdam airport is stored in the DEP_AMS variable. (The Munich airport uses a time-independent URL stored in DEP_MUC.)
Last, the script adds a time suffix to the name of the two temporary files (MUC_FILE=$MUC_FILE:$TIME and AMS_FILE=$AMS_FILE:$TIME). date converts $TIME to Unix time: date -d$TIME:00 +%s. The text browser links stores text versions of the timetables in the temporary files, stripped down to the lines that cover the current time interval. (To add auto-configuration to this plugin, add a check for links!)
In the case of Amsterdam, the script uses the first 46 characters (columns Time to Status in Figure 5) to keep the chore easy, as this timetable also includes the actual departure time (Actual column in Figure 5). The Munich airport does not publish the actual departure times, except for truly delayed flights. These delayed flights are marked as planned and will reappear in the timetable as soon as they have been rescheduled to a new departure time slot. This means that the script cannot treat planned flights within their originally scheduled departure slot, otherwise they would be counted twice.
In Munich, only flights marked as calling, boarding, and departed count as dispatched: egrep "calling|boarding|departed" $MUC_FILE | wc -l. In Amsterdam, matters are more complicated. Delayed flights are not rescheduled to a new timeslot; instead, the new departure time is listed in the Actual column. This approach is more useful for passengers, but the script ignores this column to keep the plugin simple. Additionally, the Amsterdam timetable lists all code-sharing flights with as many entries as codes (Listing 5), which is nice for passengers who find their actual flight code listed. For our statistics, only one 16:40 flight is bound for Heathrow and one bound for Durham, not three or five, respectively.
| Listing 5: Amsterdam Timetable |
01 $ egrep "Boarding|Departed|Gate closing|Delayed" /tmp/.ams_flights\:16\:40 02 16:40 AA 6507 London Heathrow Delayed 03 16:40 BA 0439 London Heathrow Delayed 04 16:40 KL 1029 London Heathrow Delayed 05 16:40 AF 8357 Durham Teesvall Departed 06 16:40 CO 9645 Durham Teesvall Departed 07 16:40 KL 1537 Durham Teesvall Departed 08 16:40 NW 8833 Durham Teesvall Departed 09 16:40 AZ 3832 Durham Teesvall Departed |
To count dispatched flights using wc -l, cut away the first 18 characters:
$ egrep "Boarding|Departed|Gate closing|Delayed" /tmp/. ams_flights\:16\:40 | cut -c19-46
London Heathrow Delayed
London Heathrow Delayed
London Heathrow Delayed
Durham Teesvall Departed
Durham Teesvall Departed
Durham Teesvall Departed
Durham Teesvall Departed
Durham Teesvall Departed
Now apply sort and uniq, and you end up with the number:
$ egrep "Boarding|Departed|Gate closing|Delayed" /tmp/ .ams_ flights\:16\:40 | cut -c19-46 | sort | uniq | wc -l
2
Counting the canceled flights is easy: The Munich airport marks them as "canceled" with a lowercase c; Amsterdam uses an uppercase C.
Now the script can assemble the output lines as shown in Listing 1 - with one restriction: The names of monitored parameters cannot include underscores (or other special characters). Although the plugin would run fine using muc_departing or ams_departing as parameter names, the Munin master wouldn't be able to store and visualize these values.
When the plugin runs with the config argument, it provides the Munin master with details about how to draw and outfit the appropriate graph. This feature requires no complicated logic - all you need to do is echo some parameter-value pairs on standard output.
There are two types of configuration parameters: those with an underscore and those with a dot serving as delimiter in the parameter name. The underscore provides information about the entire diagram; parameters with a dot tell the Munin master how to plot the individual graphs.
graph_title defines the headline for the diagram, and graph_vlabel specifies the label for the y-axis. graph_args expects command-line options to be forwarded to RRDTool (see man rdgraph). In this case, 1 k (kilo) equals 1000, and the displayed y-axis will always include the origin.
The Munin master generates only one single HTML page per host, including all daily and weekly diagrams. Categories are used to group plugins within this page. Plugins that don't tell Munin to which graph_category they belong will appear in the Other category.
The amsdeparting.label parameter defines the legend entry for the graph showing the Amsterdam departing values, while amsdeparting.draw defines that this plot (green in Figure 6) is drawn as a one-pixel-thick line (LINE1). For the two plots showing the number of canceled flights (amscanceled and muccancelled) the Munin master is supposed to use a pen of three-pixel size (LINE3), which is the thickest line available. Munin also supports area plots (*.draw type AREA) and stacked plots (STACK), with some more options available from version 1.3.3.
Although Munin provides sufficient configuration options to display most diagrams, the tool is short on options for customizing the appearance of the generated HTML pages. Also, for hosts with many plugins, Munin can take considerable time to load the host overview. A better solution would be to generate individual pages for each plugin category on a host.
Another item on the wish list would be a page that compares the graphs of one plugin on several hosts.
On the other hand, Munin integrates perfectly with Nagios [6]. Or, if you are looking for a notification tool but Nagios seems too big of a solution, you can configure Munin to send alerts on its own [7].
| INFO |
|
[1] Edward R. Tufte: "The Visual Display of Quantitative Information," Graphics Press, Cheshire Connecticut, 2ed 2001: http://www.edwardtufte.com/tufte/books_vdqi
[2] Linpro: http://www.linpro.no/en [3] RRDTool: http://oss.oetiker.ch/rrdtool/ [4] Magic Markers: http://munin.projects.linpro.no/wiki/plugin-fields [5] MuninExchange: http://muninexchange.projects.linpro.no/ [6] Integration with Nagios: http://munin.projects.linpro.no/wiki/HowToContactNagios [7] Alerts: http://munin.projects.linpro.no/wiki/HowToContac |