
By Michael Schilli
If you don't spend all day playing video games, you will be quite happy without the latest and greatest CPU, and you can save money on hardware while saving power and reducing your personal CO² footprint.
But what happens if a Perl program does not perform as well as you would like? As a first step, you might be able to accelerate the program with very little effort by optimizing the code at neuralgic points.
In most cases, just one or two targeted improvements will help you achieve 90 percent of the total optimization potential. The remaining 10 percent are more likely to involve wide-ranging, architectural changes that take 10 times as long to implement and make the resulting program so difficult to maintain that more experienced developers are likely to turn down the option.
Profilers are programs that discover bottlenecks, or hotspots. They show you where the program spends most of its time and help to optimize these crucial sections in a targeted way.
Perl has many tools of this kind. For example, if a module uses the Log4perl logging framework, it is simple to display the number of milliseconds (msec) that elapse along with the log messages, thus creating a timescale.
The simple test script amzntest (Listing 1) uses the CPAN Net::Amazon module to retrieve book details from the Amazon Web API (assuming you enter a valid token, which you can get from Amazon Web Services [2]).
| Listing 1: amzntest |
01 #!/usr/bin/perl
02 use warnings;
03 use strict;
04 use Net::Amazon;
05 use Net::Amazon::Request::ASIN;
06
07 my $asin = "0132396556";
08
09 my $ua = Net::Amazon->new(
10     token => 'XXXXXXXXXXXXXXX',
11 );
12
13 my $req = Net::Amazon::Request::ASIN->new(
14     asin  => $asin,
15 );
16
17 my $resp = $ua->request($req);
18
19 if($resp->is_success()) {
20     print $resp->as_string(), "\n";
21 } else {
22     print "Error: ",
23           $resp->message(), "\n";
24 }
|
A request takes about a second, but what does the script use this time for - picking up the data or the analyzing the XML response? Adding
use Log::Log4perl;
 Log::Log4perl->init("timer.l4p");
to the script header enables the Log4perl statements embedded in Net::Amazon by loading the timer.l4p configuration file. This outputs the date (%d) and the number of milliseconds since the program started (%r) for each message it logs. The logging level is set to DEBUG and is thus fairly verbose.
To cut down on lengthy log messages, the configuration file in Listing 2 uses the abbreviation %S to define a so-called Custom Cspec. This appears in the layout, instead of the more typical %m (for the log message).
The associated Perl subroutine returns a shorter, 25-character message to the screen appender. The layout closes with a platform-dependent newline character defined by %n.
| Listing 2: timer.l4p |
1 log4perl.logger          = DEBUG, App
2 log4perl.appender.App    = Log::Log4perl::Appender::Screen
3 log4perl.appender.App.layout = PatternLayout
4 log4perl.appender.App.layout.ConversionPattern = %d %r %S%n
5 log4perl.PatternLayout.cspec.S = sub { substr($_[1], 0, 25) }
|
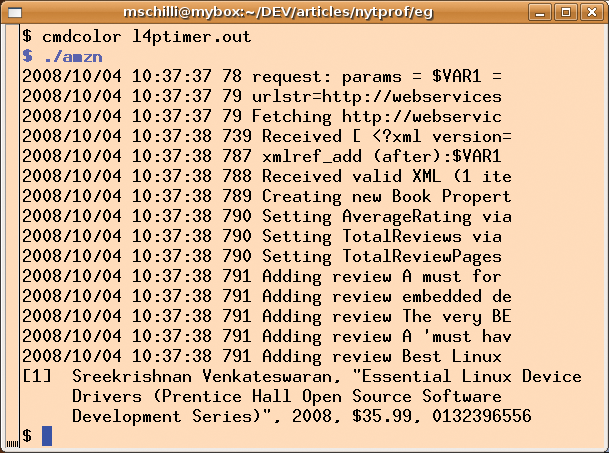
Figure 1 shows that Net::Amazon sends a web request to Amazon 79msec after the program launches; however, the XML parser does not start working until 739msec have elapsed. Thus, the web request takes 75 percent of the 800msec required by the script.
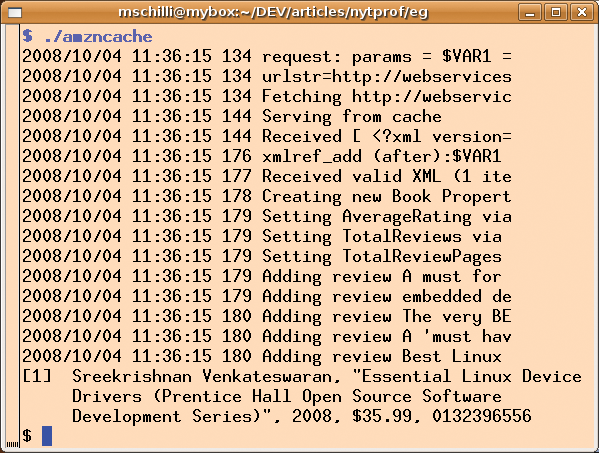
As you will agree, it makes sense to use a web cache for frequently retrieved ASIN numbers, and Net::Amazon enables this if we ask it to (see Listing 3). This really does reduce the script run time, which drops to 180msec for repetitions (see Figure 2) with the use of File::Cache as a persistent cache.
| Listing 3: Web Cache |
01 use Cache::File; 02 my $cache = Cache::File->new( 03 cache_root => '/tmp/mycache', 04 default_expires => '30 min', 05 ); 06 07 my $ua = Net::Amazon->new( 08 token => '0AQN5ZBDW6NXV9M60N82', 09 cache => $cache, 10 ); |
Now you might argue that tricks of this kind aren't always going to help, but the decisive issue here is that five lines of code and a minute spent thinking about options achieved a speed boost of 400 percent.
Of course, some modules do not have very sophisticated logging mechanisms. Thankfully, Perl has a number of profilers that measure the amount of time each line of source code uses.
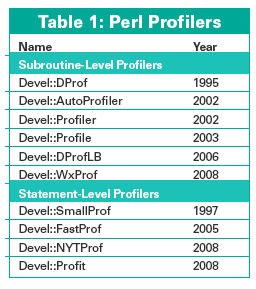
Table 1 shows the major CPAN profilers for various tasks in ascending release order.
The CPAN Devel::SmallProf line profiler autonomously measures run times and formats the data for analysis. If you launch the script you want to test via perl -d:SmallProf ./amzn, the profiler creates a smallprof.out file that lists the time used by each line in each module used.
In the case of a fairly complex action like a web request and ensuing XML analysis of the returned data, the resultant file can be enormous - in this case, it weighed in at no fewer than 25,792 lines.
Discovering the worst time hogs is not an easy task, but the shell command
sort -k 2,2 smallprof.out | less
sorts the file numerically on the second field from the left. This field contains the wall clock time in seconds used by a line of source code, which is the time actually used whether the task gave the CPU something to do or just left it idle, waiting for external events, such as incoming network packages, for example. In addition, the third field contains the CPU seconds, which is the computational time actually used.
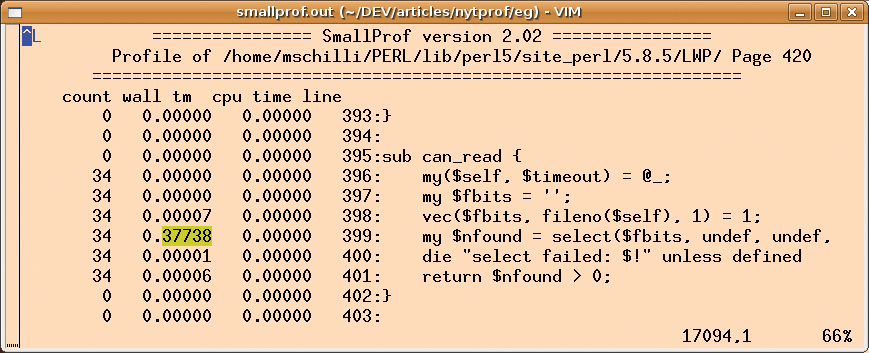
If you scroll down to line 17,104 in smallprof.out, as shown in Figure 3, you will see that the line responsible for the wait issues a select command. The can_read function in the LWP::Protocol::http::SocketMethods module is responsible for this.
The CPAN module Devel::NYTProf is a relatively new development [3]. The strange-sounding name came about because the module was developed for the New York Times and based on the Devel::FastProf codebase. Their IT department decided to release the source code.
This excellent profiler is maintained by DBI inventor Tim Bunce [4] today. Bunce presented his work to the Perl community at OSCON 2008 [5]. Although I was in the audience, I couldn't concentrate on his talk because I was up next with my Log4perl talk.
After the CPAN shell-assisted installation (perl -MCPAN -e'install Devel::NYTProf'), you type perl -d:NYTProf amzn to launch the profiler on the script. To convert its binary logfile nytprof.out to professionally formatted HTML, use the nytprofhtml script included with the package.
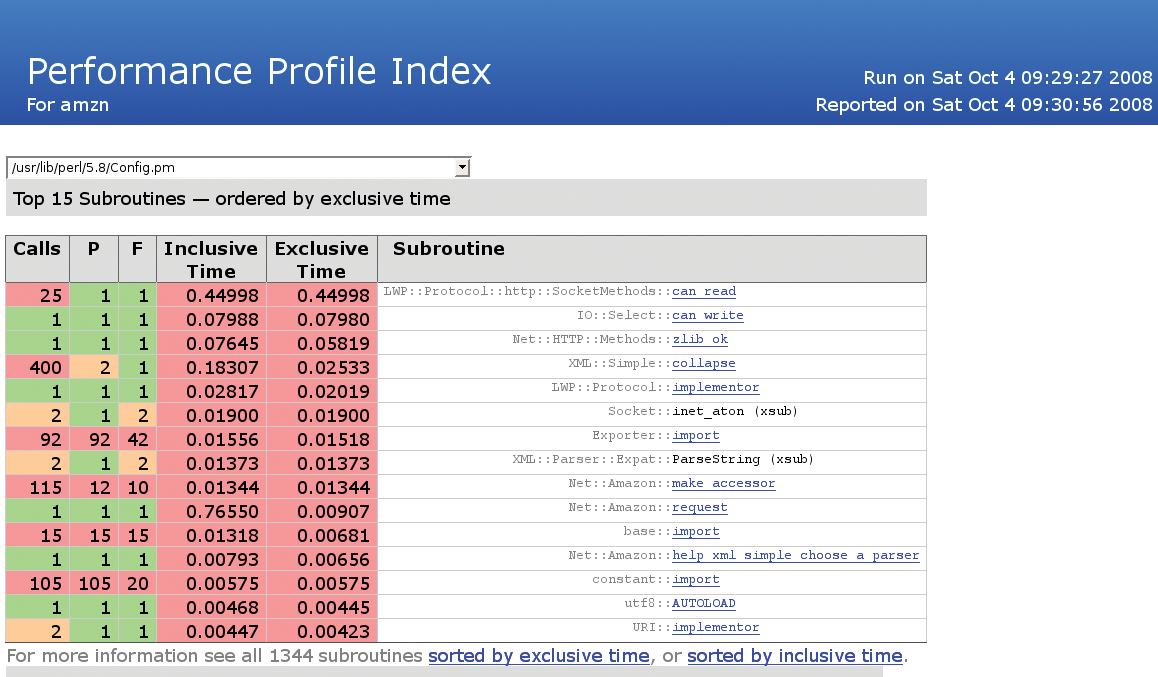
Firing up a browser and pointing it to the index.html file in the newly created nytprof directory (URL file:///...nytprof/index.html) reveals what has been going on. The table in Figure 4 lists the hotspots. It shows the number of calls, the number of places (P) they have been issued, the files (F) they are located in, and the time spent executing each function. The tool differentiates between "exclusive time" and "inclusive time," the former referring to the time spent exclusively in the function's code and the latter referring to the total time, including the subfunctions called by the function.
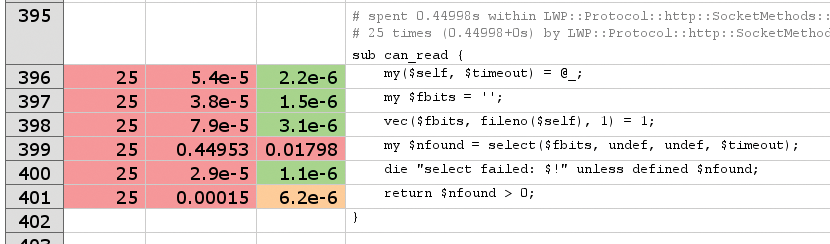
The HTML links the function names with HTML pages providing details on the function code - a very practical idea that lets the user flip back and forth and greatly facilitates the analysis. Figure 5, for example, shows details that were very difficult to obtain with SmallProf; that is, the select() command in the can_read() function in an LWP module is causing the delays. On an open network socket, it waits for the first signs of the response returned by Amazon.
NYTProf supports three different reporting modes for displaying the time spent by the source code: line mode (one time value per line), block mode (one time value per block of Perl), and sub mode (one time value per function). Clicking toggles the performance de-tective through the different display variants.
The module-level view of the profiler in Figure 6 also reveals some interesting facts. The XML analysis of the Amazon web response took 9,963 lines of code and 400 calls to the collapse() function XML::Simple.
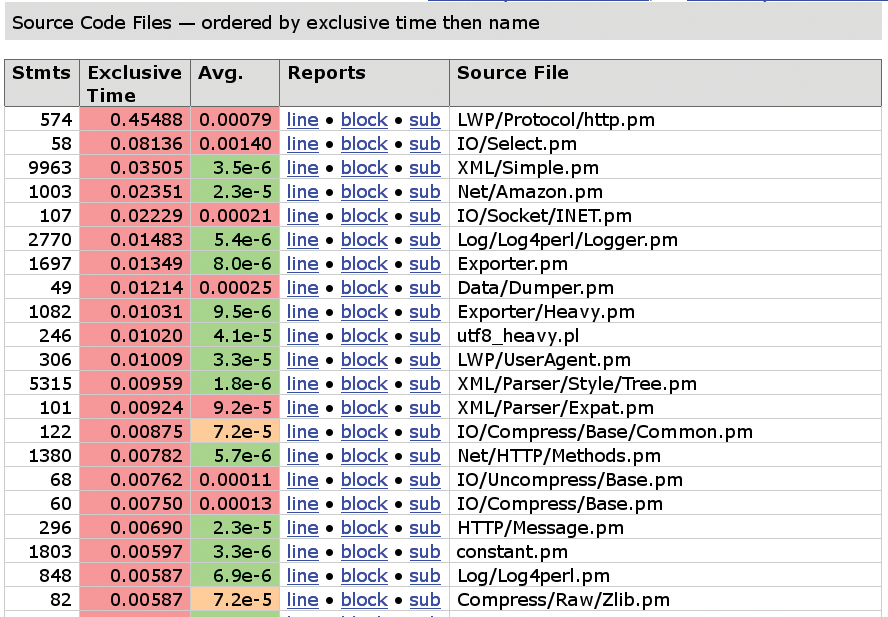
Because it ran at full speed, the whole kit and caboodle took just 35msec, but this just goes to show how complex it is to parse XML.
Just like any other profiler, Devel::NYTProf also involves some overhead that can completely falsify the measured results in some cases. The profiler's activities are particularly invasive if a program is not waiting for external events, such as network traffic or disk access, which are magnitudes of scale slower.
For a program running at full CPU speed, the run time can be 10 times longer if you enable the profiler.
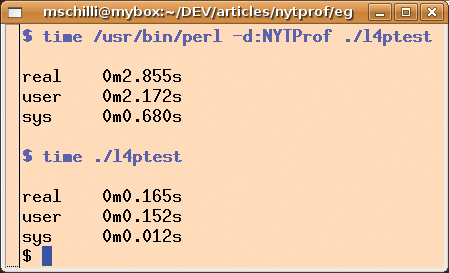
Figure 7 shows the effect the NYT profiler has on the short l4ptest test program (Listing 4). The program configures Log4perl for the $INFO logging priority and then issues $DEBUG messages, which should be suppressed because of their lower priority. Log4perl has optimized this case; after all, a disabled logging system shouldn't have any measurable effect.
| Listing 4: l4ptest |
01 #!/usr/local/bin/perl -w
02 use strict;
03 use Log::Log4perl qw(:easy);
04 Log::Log4perl->easy_init($INFO);
05 for(1..100_000) {
06     DEBUG "waah!";
07 }
|
The script running without the profiler achieves around 100,000 calls in about 100msec; the script run time is about 10 times longer with NYTProf enabled.
This by no means detracts from the quality of the profiler, but it is important to take this into consideration when measuring script run time and interpreting the results.
The module also is quite at home in the Apache server's mod_perl. Adding PerlModule Devel::NYTProf::Apache to the configuration loads the module and tells it to append profile data to the /tmp/nytprof.$$.out file for incoming requests, where $$ represents the PID for the Apache process handling the request.
Calling nytprofhtml again creates a collection of web pages for in-depth analysis of the web application's performance that could very well point you to critical code sections that need improvement.
| INFO |
|
[1] Listings for this article: http://www.linux-magazine.com/resources/article_code
[2] Amazon Web Services (developer token application): http://amazon.com/soap [3] Devel::NYTProf: http://search.cpan.org/dist/Devel-NYTProf/ [4] Tim Bunce blog "NYTProf v2 - the background story," http://blog.timbunce.org/2008/07/16/nytprof-v2-the-background-story/ [5] Tim Bunce at OSCON 2008: http://en.oreilly.com/oscon2008/public/schedule/speaker/6816 |
| THE AUTHOR |
|
Michael Schilli works as a software engineer with Yahoo! in Sunnyvale, California. He is the author of Goto Perl 5 (German) and Perl Power (English), both published by Addison-Wesley, and he can be contacted at mschilli@perlmeister.com. Michael's homepage is at http://perlmeister.com. |