
By Marcel Gagné
Sure, system adminstration is exciting. Those of us who either do this for a living or have done it in the past know the raw, visceral, even primal thrill of creating a system on which one or more organizations run their day-to-day stuff. Despite all the glamor, excitement, and glory, being a system administrator sometimes means a lot of information gathering. In other words, the day-to-day stuff can be a tedious search for the process that is bringing your system to a crawl and causing your users to call. Yes, there are those moments when you are flying to the rescue, returning Internet access to the office, while the grateful masses, from management to accounting to support services, offer their unending thanks, but mostly that isn't the case.
Usually, you spend your time keeping the system running and, perhaps more importantly, keeping it running at a perky pace. Are there any system administrators in this world who would not love to squeeze just a few more performance points out of their system - a few CPU cycles or increased disk access rates? Do you have enough memory? Is your processor (or processors) up to the job? Why is everything running so slow? Maybe it's time to put on your big game hunter hat and stalk that hungry process that's dragging everything down.
Of all the tools that can report on a snapshot of your system, uptime is an old favorite of Linux sys admins everywhere. Longtime Linux users like to use this command to show their Windows-using friends just how long a system can run without needing to be rebooted. To see how one of my older systems is doing, I enter:
# uptime
15:06:17 up 501 days, 3:06, 1 user, load average: 0.13, 0.05, 0.01
That doesn't look too bad, really. Up 501 days, three hours, and six minutes. The only person logged on is myself, but a lot is happening despite the low load average. Incidentally, the last reboot on this machine was planned. But let me explain this load average thing.
The load average is 0.13 over the past minute, 0.05 over the past five minutes, and 0.01 over the past 15 minutes. Load average is just that, an average. It is an indication of the number of processes in the CPU's run queue, that is, the number of processes active or waiting to execute. Think of the load average as the number of patients in a waiting room queued up to see a doctor. The higher the number for load average, the more likely it is that your system is starting to suffer under an excessive load and the more likely users will start ringing your extension. As the popular expression goes, "your mileage may vary," but I tend to think of anything under 4 as acceptable. Any higher and it starts feeling slow. Although it's virtually impossible to tell just what an acceptable load is, the user experience will define that for you. When the phone starts ringing, you'll know.
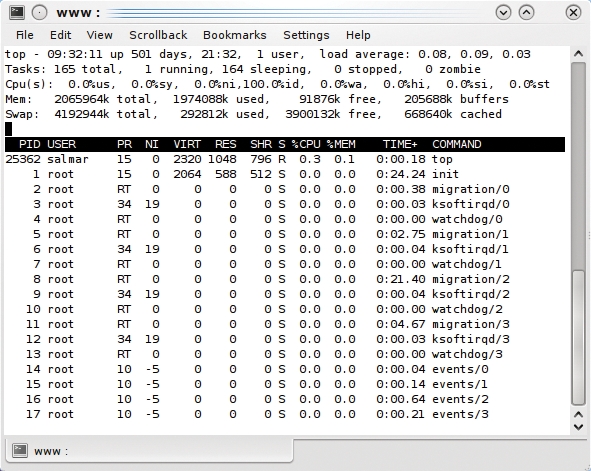
For a more comprehensive peek into what your system is doing, try the top command. This command is so popular that there are many, many variations on the theme, some of which I will show you momentarily. To begin, open a terminal window and type top, then watch the action for a few seconds. The first thing you'll notice is that the load average numbers from the uptime command are also part of the Top display. Running Top delivers far more information than the uptime command does by itself, including the actual number of processes, distribution of work done between system and user processes, memory utilization, and more.
The load average numbers are pretty tiny. From this interactive screen, you can kill (send SIGNALs to) processes (press k at any time and enter the PID and signal), and renice processes that don't need the system's full attention by pressing r. Also, you can change the sort order of the fields by pressing o. If you are curious about the various combinations, try pressing h for help while Top is running.
For reports on real-time activity and to give me a feel for just what is eating a system's resources, I like to run Top in its own window. A note of caution here: If you are going to do this, and you have a habit of walking away from your terminal without locking your screen (which is probably a bad idea anyway), you might want to start Top like this:
top -s
This starts Top in secure mode. If you try to press k now, you'll get a nice "Can't kill in secure mode" message. Think of it as leaving the safety on. Consider putting a single s in the /etc/toprc file to make this the default. Also, you might want to change the refresh rate, or just how long you want to keep Top running, or concentrate on that one user who seems to be using up all the system resources. Try the following
top -d 2 -n 60 -u anewt
without the -s just in case you might need to kill some processes. The -d changes the refresh rate (the delay) from the default of five seconds to two seconds, whereas -n specifies the number of refreshes before Top automatically terminates. The -u tells Top to watch only user anewt's processes instead of every user on the system.
When you think of the programs that have made it, you start looking for those they inspired. In that respect, Top really is the tops. Running processes is what computers do, but trying to make sense of how a specific class of processes affects a system is where Top inspired some of its cousins. For instance, a great many Linux servers are referred to as LAMP servers because they run applications built on Linux, Apache, MySQL, and Perl (or PHP). This environment is where a couple of Top's close relatives, and some of my favorites, abide.
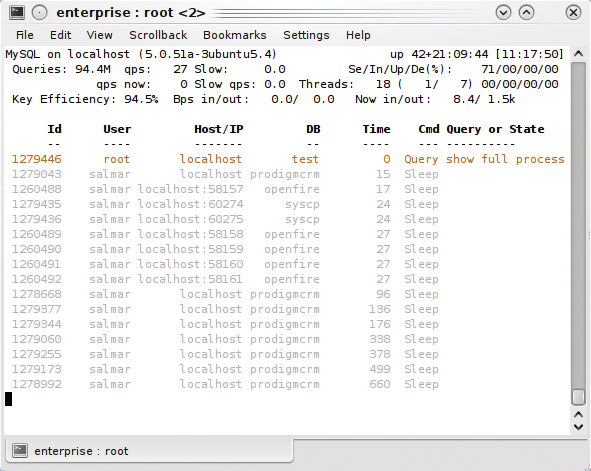
As you might expect, Mytop is a Top dedicated to snooping on MySQL and its processes. To run it, you need to specify the admin user and its password on the command line:
mytop -u adminuser -p adminpass
Mytop's display is color highlighted by default, but you can turn this mode off by adding a --nocolor at the end of the command line.
Some of the great information here ranges from the number of queries and queries per second to active threads, key efficiency, data transfer rate, and more. To see the modifiers you can use, press ? while Mytop is running. Some options include p to pause the display, o to reverse the sort order, or m to switch to a queries per second scrolling view. And you can even kill a specific thread by pressing k.
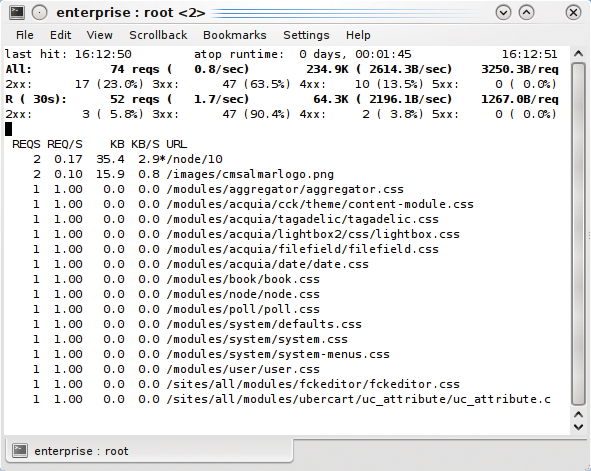
Over on the Apache side, you know there's another Top just waiting for you. Once again, the idea is to generate a display that resembles the venerable Top, but with information related to your Apache server processes.
To begin, it is important to understand that Apachetop uses your Apache logfile as the basis for its display. Therefore, you need to either let it access the default combined logfile or, if you have multiple logfiles, specify them on the command line.
apachetop -H -r 2 -f /var/log/apache2/mysite-access_log
The -H tells Apachetop to report on hits rather than hits per second (that would be the -T option), whereas -r 2 refreshes the display every two seconds.
Although I've only shown you -f pointing to one file, you can specify multiple files to watch if you need to keep an eye on more than one website.
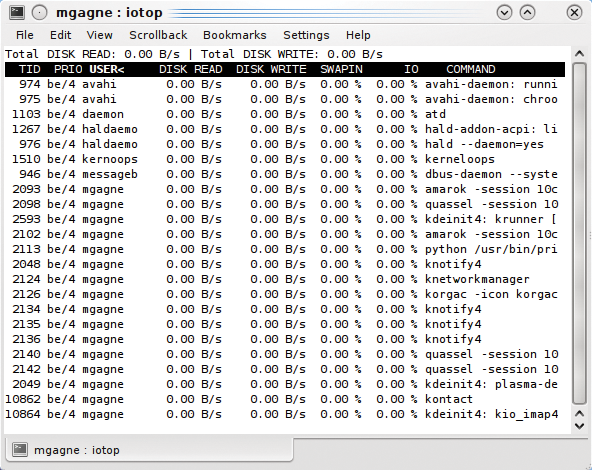
Some will tell you that the element with the greatest effect on any system is disk I/O. If you fall into this camp, you'll be thrilled with the Iotop command, a Top-like monitor that concentrates on providing I/O stats for the various running processes (see Figure 4). Using your left and right cursor keys, you can easily move between columns and sort the display accordingly. Also, you might want to press a to show an accumulated display of activity.
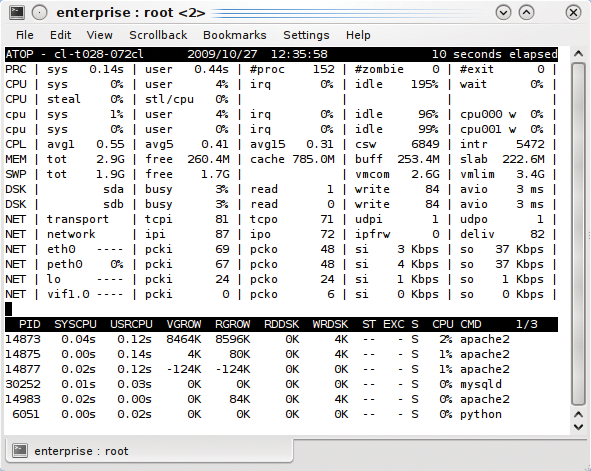
Of course, plain old Top has its own updates. For example, Advanced Top, or Atop if you prefer, provides information that is meant to be a little over the top, giving you the kind of data classic Top doesn't deliver.
The Atop utility displays the resources consumed by all processes that were active when it sampled. Even those that have terminated in that time are still visible. Every network interface is monitored, with packets in and packets out, along with transfer rate across interfaces. Atop stores raw data for a default of 28 days to better present a picture of system utilization over time. Because it's not just a question of now, but when and for how long, you get accumulated data on a per user and per process basis.
As you play with Atop, you'll discover that it is also a critical resource warning tool, indicating processes that go beyond a certain percentage of resources - whether CPU, memory, disk, or user. The package also sports a great little reporting tool called Atopsar, similar to the old Unix sar. Listing 1 shows the output from Atopsar for 15 seconds of data over three iterations (= 45 seconds).
| Listing 1: Atopsar Output. |
01 # atopsar -c 15 3 02 cl-t028-072cl 2.6.24-24-xen #1 SMP Sat Jul 25 00:09:35 UTC 2009 x86_64 2009/10/27 03 -------------------------- analysis date: 2009/10/27 -------------------------- 04 13:50:48 cpu %usr %nice %sys %irq %softirq %steal %wait %idle _cpu_ 05 13:51:03 all 3 0 3 0 0 0 26 68 06 0 2 0 3 0 0 0 51 44 07 1 4 0 2 0 0 0 2 91 08 13:51:18 all 1 0 2 0 0 0 44 53 09 0 1 0 4 0 0 0 86 8 10 1 0 0 0 0 0 0 1 99 11 13:51:33 all 3 0 4 0 0 2 41 51 12 0 4 0 7 0 0 1 80 8 13 1 2 0 0 0 0 2 1 95 |
A nice variation on the classic Top theme is Htop (Figure 6), which looks a little different, mostly because its display is color highlighted, thereby making it easier to read. Certain things like CPU load and memory use are shown graphically, or at least as graphically as you can with ncurses. What really makes this a great alternative to Top, however, is that you can scroll through the list of processes. Htop has one-touch function key modifications to the display, such as F4 to invert the listing from the highest CPU load process to the lowest, F5 for a treed view of the process display, F3 to search for a specify process, and F8 to renice a process or F9 to kill it.

Everyone who works at the command line from time to time knows about the ps command. Usually, the format involves ps -ef | grep someprocess so that you can kill someprocess. If you type ps ax, you get a list of all running processes on the system. To see processes as a hierarchy of which process launched (or might currently be controlling) which other process, you use the so-called forest view.
ps axfww
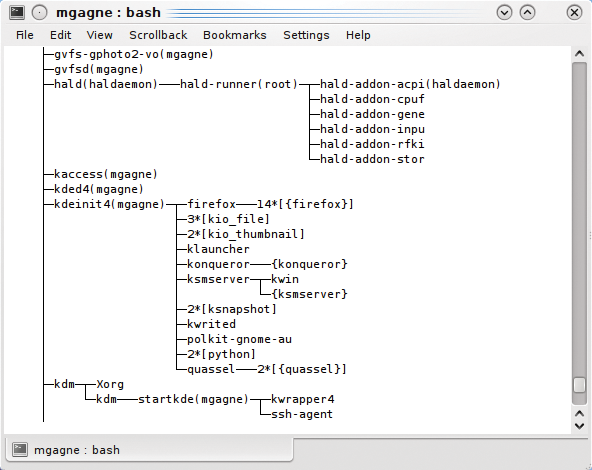
The f sorts processes to show parent and child in a tree view. The ww tells ps to provide a very wide view of the results so you can see the whole of each command, with long lines wrapped if need be. Although it's not quite as useful, Pstree is also at your disposal (Figure 7).
Those of you running either KDE or Gnome as your desktop have some alternatives to Top that do essentially the same thing but with a bit more flash. These programs are available from the desktop menus, but you can also call them from the command line.
Modern versions of KDE and Gnome provide very slick process monitors. On a KDE 4.3 desktop, clicking Alt+F2 brings up Krunner, the KDE program launcher. A wrench icon and a small rectangle with a wavy line running through it appear at the top right. Clicking the wrench provides you with a means of configuring Krunner's many plugins.
Krunner can do math, look up recently used web pages, do a desktop search, and run commands. And, you can fire up a slick, Top-ish, system activity monitor.
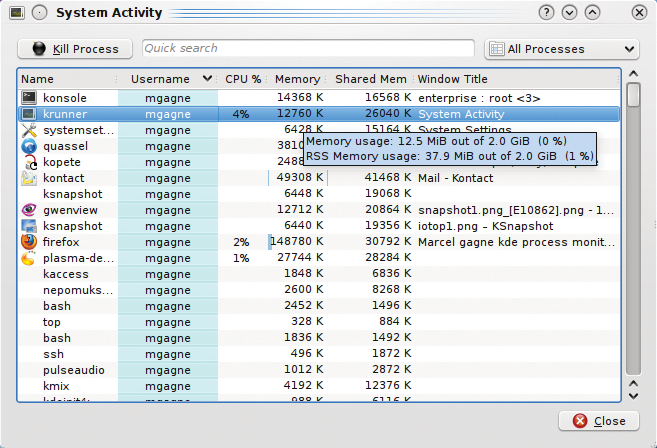
Clicking the squiggly-line box fires up the system activity process monitor (Figure 8). At a glance, you can see every process running under your desktop, including the amount of CPU and memory it is using (both system and shared). Mousing over a program name (first column) reveals more information about that process. To get more information about CPU usage, shared memory, or any other column, mouse over the appropriate item.

Also note that you can kill a process from the same window. The first step is to highlight the process, then click the Kill Process button at the top left. Right-clicking on a process lets you send other signals to the process, allowing you not only to terminate but also renice, suspend, monitor input/output activity, and more.
The Gnome desktop has a similar tool that you can access by clicking on the top panel menu, selecting System | Administration | System Monitor. As before, this monitor shows you the various running processes and provides additional information from a right-click menu. The same menu lets you send signals to suspend or terminate processes. One of the things I rather like about this monitor is that it includes a graphical resources monitor as well.
The four tabs available each provides views into different areas of the system. The System tab is largely informational, showing your OS release. The Processes tab displays the Top-like process table from which you can interact with running jobs. The Resources tab displays a running graph of CPU, memory, swap, and network activity. Finally, the File Systems tab shows percent use of your various filesystems.

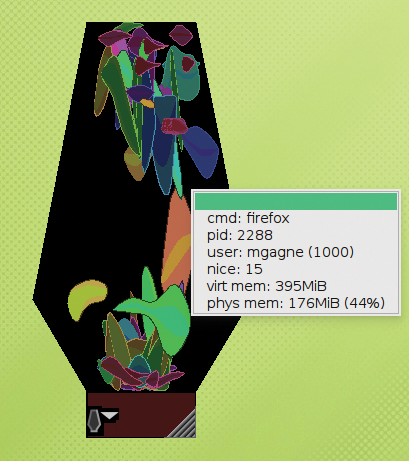
As you have seen, when you view things from a different perspective, you can gain a new appreciation, even for the ever-changing yet familiar landscape that is your system. Indeed, it can be a mind-expanding experience, as I will show you with the last application I discuss in this article. The youngsters out there might well wonder what I am referring to when I mention a lava lamp, but I know some of you have spent many hours contemplating the rising and falling blobs within. Consequently, whether Lavaps makes a great process monitor or not will depend on your feelings toward these classics.
The idea here is that processes are represented as fluid blobs in a lava lamp. The larger the blob, the greater a process's memory usage. The faster a blob moves, the greater the associated process' CPU usage. Like any decent process monitor, it allows for identification of processes, renicing, and killing. Right-clicking on a blob brings up a menu. The top menu (proc) tells you the process ID and the name of the process. You might then choose to send various signals to the process - from forceful termination to temporary suspension. If you just want to see some information about the process, you simiply left-click (as in Figure 11). Incidentally, if Lavaps appears a little small to start, click and drag the little handle in the lower right of the base. To move it around on your desktop, hold down the Alt key, then click and drag it to where you want it to live. Although I love this program, I wish someone would update the graphics with something more up to date. Inasmuch as you can update a lava lamp, that is.
If you can't find one of the tools mentioned in this article, search the standard repository of your distro.
| THE AUTHOR |
|
Marcel's an award-winning columnist, book author, public speaker, radio and television personality, and a well-known voice in the Linux and open source universe. He's also a published science fiction author and editor, a private pilot, and was once a Top 40 disc jockey. He folds a mean origami T-Rex. |