
By Gerhard Laußer
The Nagios monitoring system is a popular tool for keeping tabs on network services and devices. Sys admins around the world depend on Nagios and its gallery of plugins to keep systems running and catch problems before they erupt. But some Nagios users see room for improvement.
Nagios's architecture is relatively unchanged since the project was founded 10 years ago, and the success of Nagios has caused bottlenecks that have led to delays in implementing important community patches. The Icinga Nagios fork from Spring 2009 caused a brief flare-up of development activity, and two developers were added to the Nagios team, but this development did little to change the situation. The release of Nagios XI, a commercial product based on the free Nagios core, gave rise to speculation that principal Nagios developer Ethan Galstad was taking on additional tasks that might further fragment his time. At the same time, alternative monitoring systems have become more competitive over the years. Other open source tools, such as Zabbix or OpenNMS, are starting to gain a foothold in the enterprise segment with their active development teams, and because they are newer, these alternative systems provide more support for contemporary programming languages and distributed environments.
Jean Gabès responded to these challenges by launching Shinken, a new implementation of Nagios in the Python language. Around the end of 2009, Gabès released a Shinken proof-of-concept version, and he boldly called for developers to focus on developing a future version 4 of Nagios around Shinken.
According to Gabès, Shinken is designed to address a pair of Nagios problems:
The goal of Shinken is to provide a new multi-process distributed model that adapts well to diverse, distributed environments.
| Foundations |
|
Because it was programmed in Python, Shinken will run on any system that has a Python implementation: This currently includes Windows, meaning that Shinken could be run on the Microsoft operating system without a port. For smaller companies that would like to introduce open source monitoring but do not possess the necessary Unix know-how, this is definitely an interesting feature. This portability also applies to larger environments and scenarios in which some of the monitoring infrastructure could be Windows based. For example, you could assign all your Windows clients to a windows realm and install a separate scheduler and pollers. All of your Windows checks would then run on dedicated Windows pollers. |
In contrast to Nagios, Shinken doesn't rely on the Swiss army knife approach of using a single process to parse the configuration, handle scheduling, run checks, and handle scripting. Instead, Shinken uses multiple processes, and each process only handles a portion of the overall workload. This approach optimizes performance and lets the various parts of the system complete their tasks without getting in each others' way.
A Shinken system includes five processes (Figure 1):
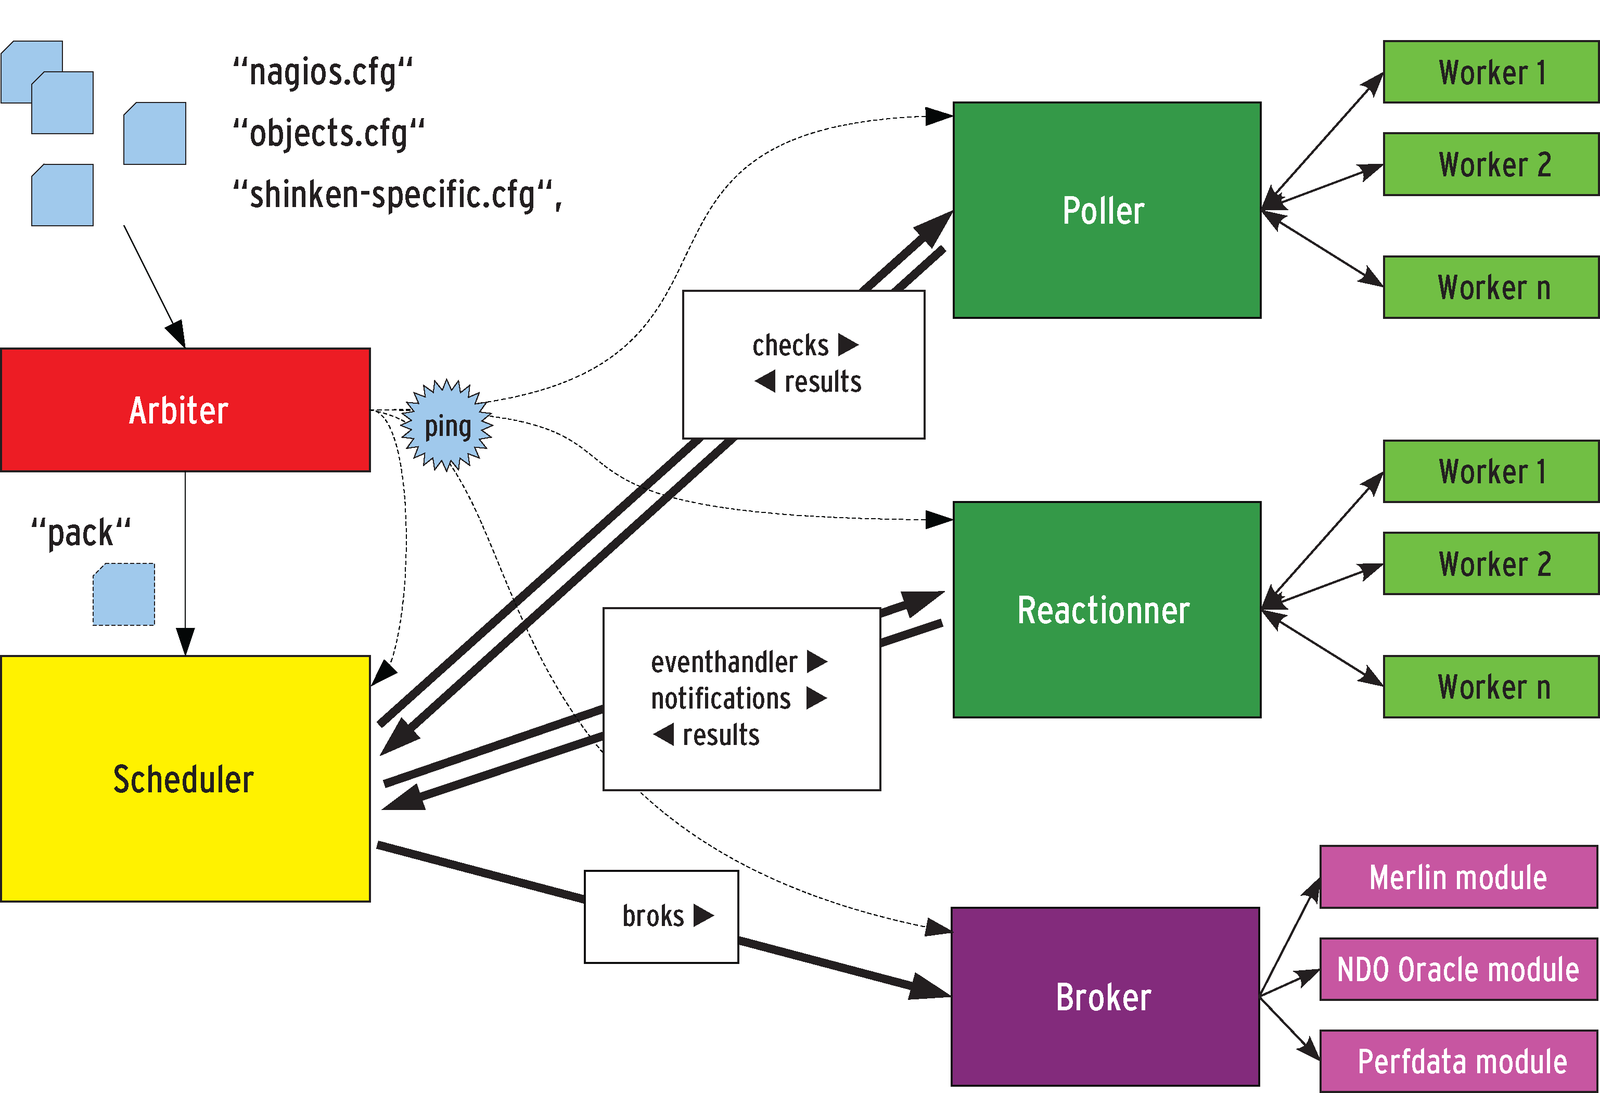
This multi-process approach makes it easy to design a module that forwards any data that has been generated to any kind of third-party system. Again, in contrast to Nagios, database downtime will not bring the whole monitoring setup to its knees. Even when status.dat, which can be huge, is written, it does not slow down the central process because the write operation is handled asynchronously.
After distributing the configuration, the Arbiter dedicates itself to monitoring the Shinken system. It pings the individual components and dispatches updates if a reconfiguration of the communication paths becomes necessary after a component failure.
The various Shinken processes can exist in multiple instances to help distribute the load. They don't even have to run on the same machine. Load balancing is really easy to establish with Shinken: Users simply need to configure multiple Pollers in the shinken-specific.cfg file and make sure they run on multiple machines (Figure 2). The configuration for this would look like the excerpt in Listing 1.
If you configure multiple schedulers, the arbiter will distribute the configuration. The result is that each scheduler has approximately the same number of services to handle.
| Listing 1: Load Balancing |
01 define poller{
02 poller_name poller-All-1
03 address shinken1.muc
04 port 7771
05 realm All
06 }
07 define poller{
08 poller_name poller-All-2
09 address shinken2.muc
10 port 7771
11 realm All
12 }
|
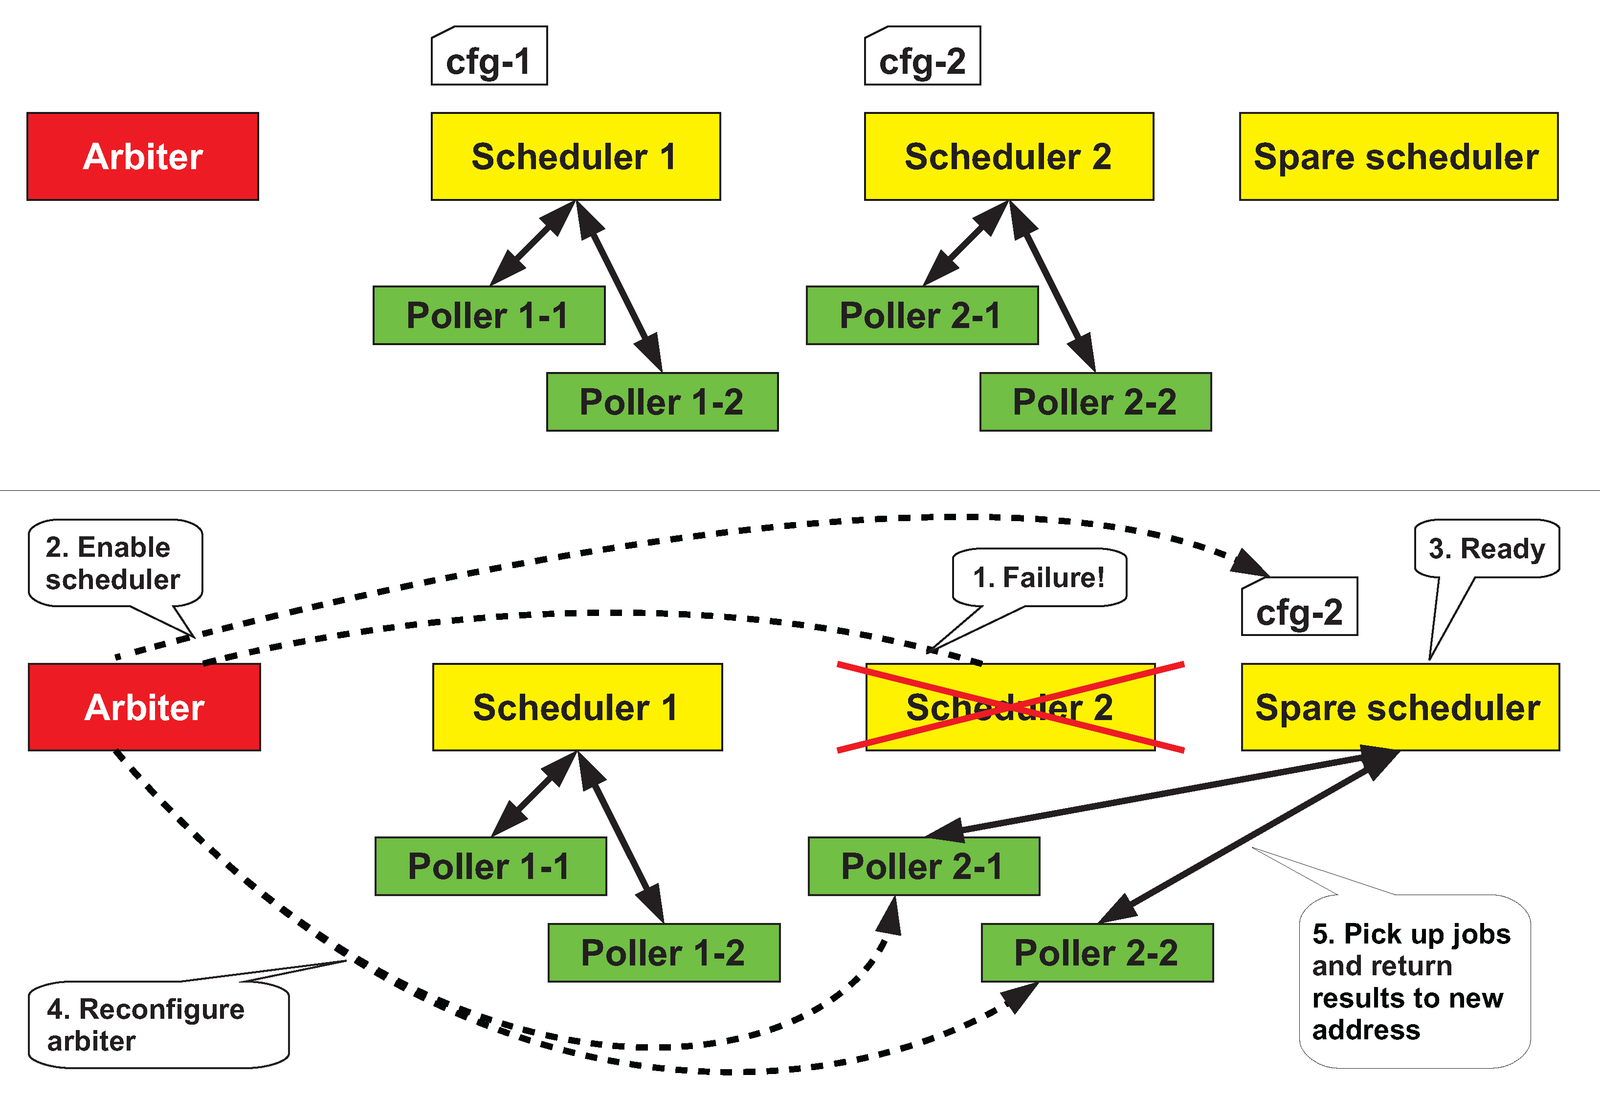
Spare daemons can prevent the system from suffering in the case of failure. A spare daemon is not assigned any tasks when it is started, but if an active process crashes, the spare process steps in to replace it. This mechanism is available for any kind of daemon. Listing 2 provides an example.
| Listing 2: Spare Daemons |
01 define poller{
02 poller_name poller-All-1
03 address shinken1.muc
04 port 7771
05 realm All
06 }
07 ...
08 define poller{
09 poller_name poller-All-spare
10 address shinken9.muc
11 port 7771
12 realm All
13 spare 1
14 }
|
A Poller process named poller-All-1 runs on the Shinken1 node and continually runs plugins. If this process, or the whole Shinken1 server (which is probably more likely) crashes, the Arbiter detects the crash. It then sends the Poller on the Shinken9 node a request to help out. The Poller then turns to the Scheduler responsible for the node, picks up the jobs from the Scheduler, and executes the jobs, returning the results to the Scheduler's result queue.
From the Scheduler's point of view, basically nothing has changed. In fact, the Scheduler couldn't care less who picks up check jobs and returns the results.
Shinken lets you organize the Scheduler, Poller, Reactionner, and Broker in a logical group known as a realm. If you then assign the optional realm attribute to hosts or host groups, they will only work within their own process group. Because Shinken processes can run on different servers, this approach makes it possible to set up a distributed system.
With Nagios, you would need individual configurations for the individual locations, or you would need to disable some active checks. Shinken, however, automatically dissects a single Nagios configuration and distributes it to the Pollers to let them check hosts locally (Figure 3).
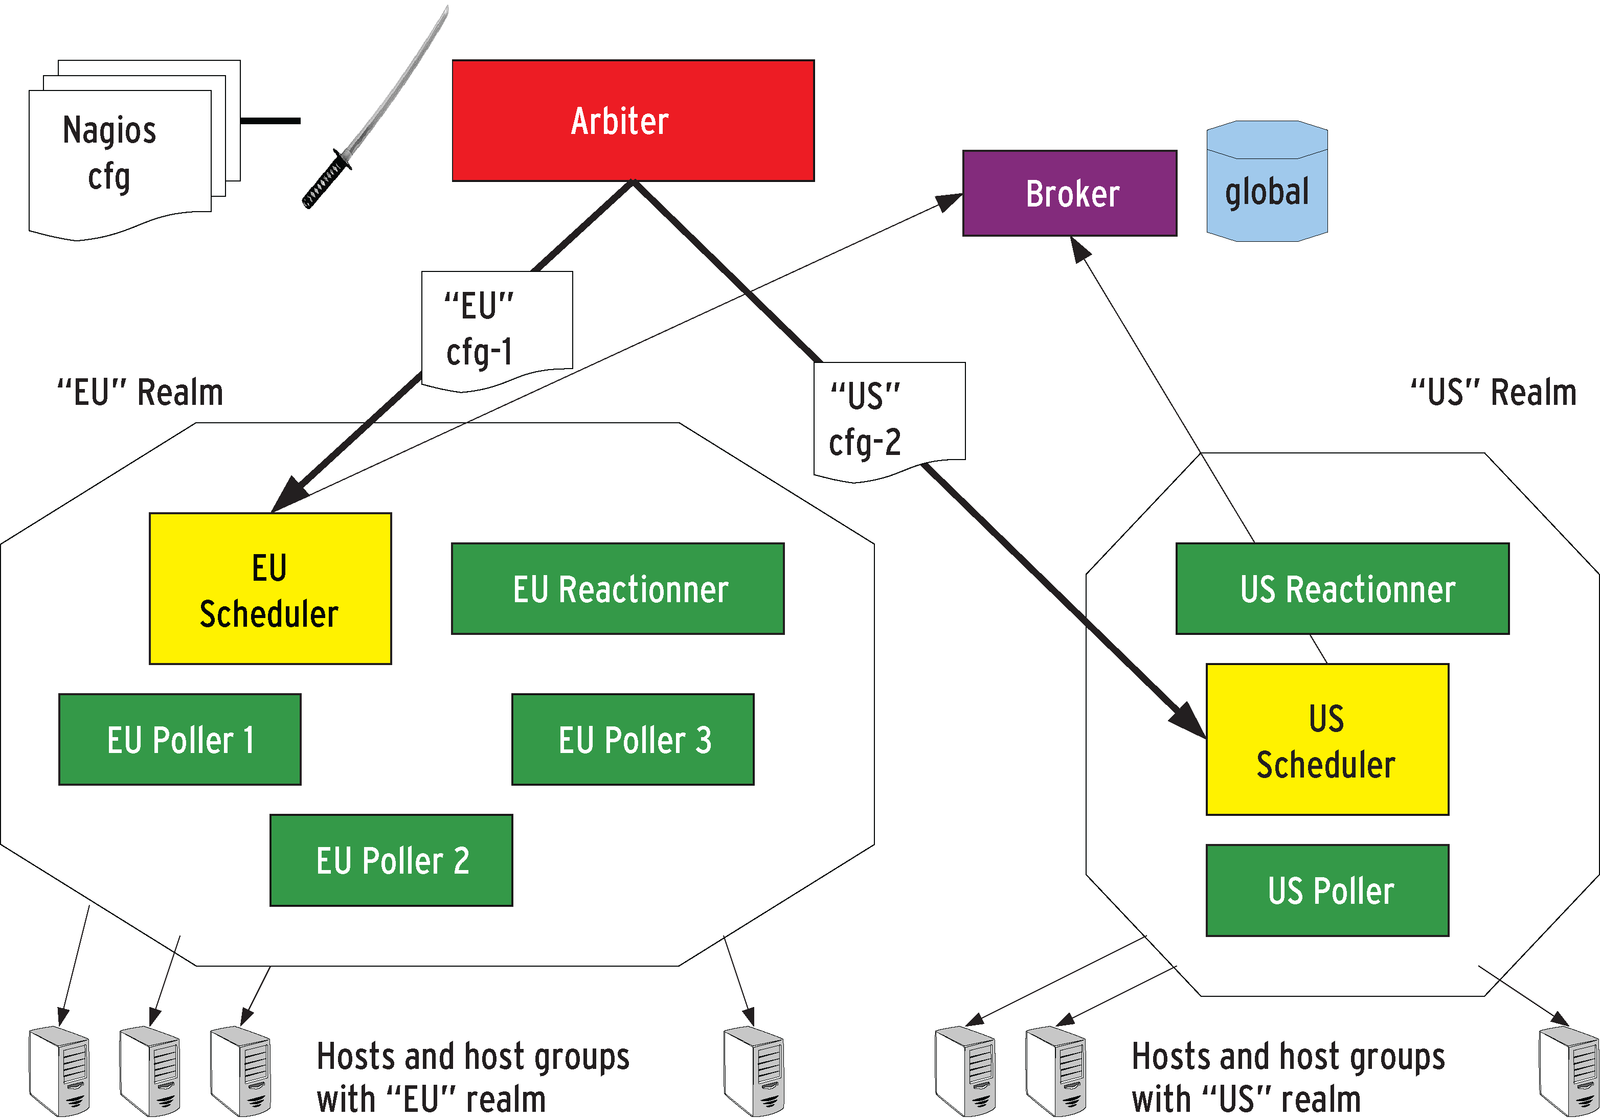
In tangible terms, this means that a US corporation could have a Poller in the US assigned to check the clients at its US subsidiary.
Shinken is not intended for production use at this time. However, if you are interested in testing its potential, the following sections show how to set up a test environment.
If you are familiar with Nagios, keep in mind that some very pronounced differences exist because of the different processes and the new configuration files.
To start, create a temporary directory in which you will store the Shinken sources and all your configuration files and plugins. After completing the test, you can delete this directory if you are not happy with what Shinken gives you. The Shinken sources are hosted on SourceForge [1]. With the following git command, download the latest sources for your test:
cd /tmp/shinken_test
git clone git://shinken.git.sourceforge.net/gitroot/shinken/shinken
This gives you a shinken directory with the src subdirectory. Later, you will launch the system from this directory.
The Perl Monitoring::Generator::TestConfig module by Sven Nierlein, which automatically creates test configurations [2], is a big help. With this module, you can generate a set of configuration files, including plugins, that resides in a single selectable directory with no outside dependencies. To simulate a live environment, the host and service states can change at selectable intervals. The Perl script in Listing 3 creates a simulated environment in the /tmp/shinken_test directory.
| Listing 3: Configuration Generator |
01 use Monitoring::Generator::TestConfig;
02 my $mgt = Monitoring::Generator::TestConfig->new(
03 'output_dir' => '/tmp/shinken_test',
04 layout => 'shinken',
05 binary => '/usr/local/nagios/bin/nagios',
06 overwrite_dir => 1,
07 hostcount => 10, # frei waehlbar
08 routercount => 1, # frei waehlbar
09 services_per_host => 10, # frei waehlbar
10 host_settings => {
11 check_period => '24x7',
12 },
13 service_settings => {
14 check_interval => 5,
15 retry_interval => 1,
16 },
17 # only if you set up a separate shinken-user
18 # otherwise the current user.
19 'main_cfg' => {
20 'nagios_user' => 'shinken',
21 'nagios_group' => 'shinken',
22 },
23 );
24 $mgt->create();
|
Calling the script creates the files in /tmp/shinken_test/. The brokerd.cfg file serves as an example of the daemon configuration files. To use it, you will need to customize a few of the settings (Listing 4).
| Listing 4: brokerd.cfg |
01 [daemon] 02 workdir=/tmp/shinken_test/var 03 pidfile=%(workdir)s/brokerd.pid 04 interval_poll=5 05 maxfd=1024 06 port=7772 07 host=0.0.0.0 08 user=shinken 09 group=shinken 10 idontcareaboutsecurity=no 11 modulespath=/tmp/shinken_test/shinken/src/modules |
The daemon configuration files share the workdir, pidfile, port, host, user, group, and idontcareaboutsecurity parameters. These parameters are fairly self-explanatory and define where the PID file resides, which port and which IP address the daemon listens on, and the user account for the daemon.
The final parameter, idontcareaboutsecurity, is only significant if you are running the daemon with the root account. Normally, you are not permitted to do this, but if you have a good reason to do so, you will need to set this parameter to yes.
The path from which the individual processing modules are loaded is important to the Broker. To define this path, you need to set the modulespath argument to the corresponding path in your test directory. In this example, the path is /tmp/shinken_test/src/modules.
Investigating the shinken-specific.cfg file is worthwhile at this point. This file contains all the components for a Shinken installation and is mainly used by the Arbiter for the purpose of monitoring the system and remotely controlling its members.
Before you launch Shinken for the first time, you must first configure the Broker (Listing 5) so that at least two modules exist. One is a simply a logfile in a style similar to Nagios. It also makes sense to use the status_dat type module. This module creates the objects.cache and status.dat files you need if you want to check out the active Shinken instance from an existing Nagios installation web interface.
| Listing 5: Broker Configuration |
01 define broker{
02 broker_name broker-All
03 address localhost
04 port 7772
05 spare 0
06 realm All
07 manage_sub_realms 1
08 manage_arbiters 1
09 modules Status-Dat,Simple-log
10 }
11
12 define module{
13 module_name Simple-log
14 module_type simple_log
15 path /tmp/shinken_test/var/nagios.log
16 }
17
18 define module{
19 module_name Status-Dat
20 module_type status_dat
21 status_file /tmp/shinken_test/var/status.dat
22 object_cache_file /tmp/shinken_test/var/objects.cache
23 status_update_interval 15
24 }
|
After completing the prep work, launch the Shinken system. To do so, change directory to /tmp/shinken_test/shinken/src and run the commands shown in Listing 6 in succession. The -d parameter runs the programs in the background. If you are curious about what is going on, you can leave this parameter out and run each process in a separate window. Doing so means you can read the information that the individual processes output at run time.
| Listing 6: Starting Shinken |
01 cd /tmp/shinken_test/shinken/src 02 python shinken-broker.py -d -c /tmp/shinken_test/etc/brokerd.cfg 03 python shinken-reactionner.py -d -c /tmp/shinken_test/etc/reactionnerd.cfg 04 python shinken-poller.py -d -c /tmp/shinken_test/etc/pollerd.cfg 05 python shinken-scheduler.py -d -c /tmp/shinken_test/etc/schedulerd.cfg 06 python shinken-arbiter.py -d -c /tmp |
As I mentioned, you can use the CGIs belonging to an existing Nagios installation to add a web interface for the Shinken instance you just launched by setting the main_config_file parameter in the /usr/local/nagios/etc/cgi.cfg file to a value of /tmp/shinken_test/nagios.cfg.
Alternatively, you can configure the Broker to write to a database with the Merlin DB MySQL module. A Merlin database is the basis for the Ninja [3] web front end. This configuration also provides a virtual machine, although it is somewhat long in the tooth.
The Shinken project is at an early stage, and more features need to be implemented. The goal is to ensure that configuration files are 100 percent compatible with Nagios - probably by May 2010. At that point, Gabès probably will call on Galstad again to use Shinken as the basis for future Nagios versions. The project website [4] has more details on Shinken, including the roadmap.
| INFO |
|
[1] Shinken download: http://sourceforge.net/projects/shinken/
[2] Test configuration generator:http://github.com/sni/Monitoring-Generator-TestConfig [3] Ninja: http://www.op5.org/community/projects/ninja [4] Shinken homepage:http://www.shinken-monitoring.org |
| THE AUTHOR |
|
Gerhard Laußer is responsible for monitoring with the Munich-based ConSol corporation. He has published a book on Nagios (in German), as well as many plugins. Gerhard has been using Linux for more than 15 years and regards himself as an open source evangelist. In his free time, he practices Krav Maga or helps develop Shinken. |