
By Andrej Fink
If some piece of hardware or software refuses to work, you can't log in, or a file, print or web server isn't responding, the logfiles on a Linux system very often give you the hints you need to solve the problem. Logs such as /var/log/messages or /var/log/auth.log keep a watchful eye, but they do so slowly enough for users to be able to investigate their content using standard tools (e.g., tail, less, cut, grep, etc.).
Other logfiles explode into impenetrable text jungles and make it difficult for mere mortals to see what's relevant. The access logs on a public web server, for example, contain details of the date and time, the contacting IP address, and the requested URL for each request. Also, the web server logs the status code (e.g., 200 OK or 404 Not Found), the traffic volume, and, depending on the configuration, much more. All told, whenever a browser accesses a website with images, JavaScript, and stylesheets, several lines of logfile content will be created.
When you are exploring the logfile jungle, you can't just rely on having good eyesight. Instead, you need a guide in the shape of a logfile viewer. These tools look for certain strings and filter out irrelevant information. Additionally, you will probably want the viewer to show you new entries automatically because logfiles are often fairly meaningless unless you view them in real time. After all, if you just wanted to view the content, you could use a text editor or a pager. Color highlighting of keywords is also a neat feature, although not strictly necessary. Just like syntax highlighting in an editor, this feature can facilitate a search for certain information.
In our lab, I put three logfile viewers through their paces: KSystemLog [1] is part of the KDE Software Compilation and tries to help users through the logfile maze with a graphical interface. Its Gnome counterpart, the Gnome System Log Viewer [2], follows the same approach, but with a more spartan interface that tries to entice the user into exploring. MultiTail [3] is a very different beast - this text-based application is an extension of the tail command and simply displays interwoven or horizontally or vertically separated logs.
By default, the KDE logfile viewer begins with a view of the system logfile (/var/log/syslog). The entries in the logfile are organized like a spreadsheet, in which you can view, hide, and change the order of the columns. KSystemLog runs the logfiles through a parser when it is loaded to construct the correct columns for the files. The KDE tool automatically refreshes the view and highlights new logfile entries in bold type. By default, the viewer also jumps to the new lines, although you can disable this feature in the context menu.
KSystemLog will normally show you the last 1,000 lines in a logfile, although the program settings let you expand this to 30,000 entries. You can click to highlight a line or multiple lines, copy the selection to the clipboard, store it in a text file, print it, or mail it. KSystemLog will only work with the content of the highlighted lines; you do not get the name of the logfile or other useful metadata.
The toolbar and the Logs menu give you quick access to other logfiles. If the logfiles defined by the program are not sufficient for your purposes, you can open a file browser to find the required log. KSystemLog will automatically try to apply the syslog schema. This might not be a perfect solution, however, in that many programs have their own ideas of how to organize things and do not pass things on to syslog.
Pressing Ctrl+F displays a search box below the log table that you can use to look for keywords. As an alternative to this, a filter bar above the table lets you restrict the display to specific entries. The detailed view shows selected lines in a separate dialog, which contains the full entry along with additional information, such as the date, logfile, or process name.
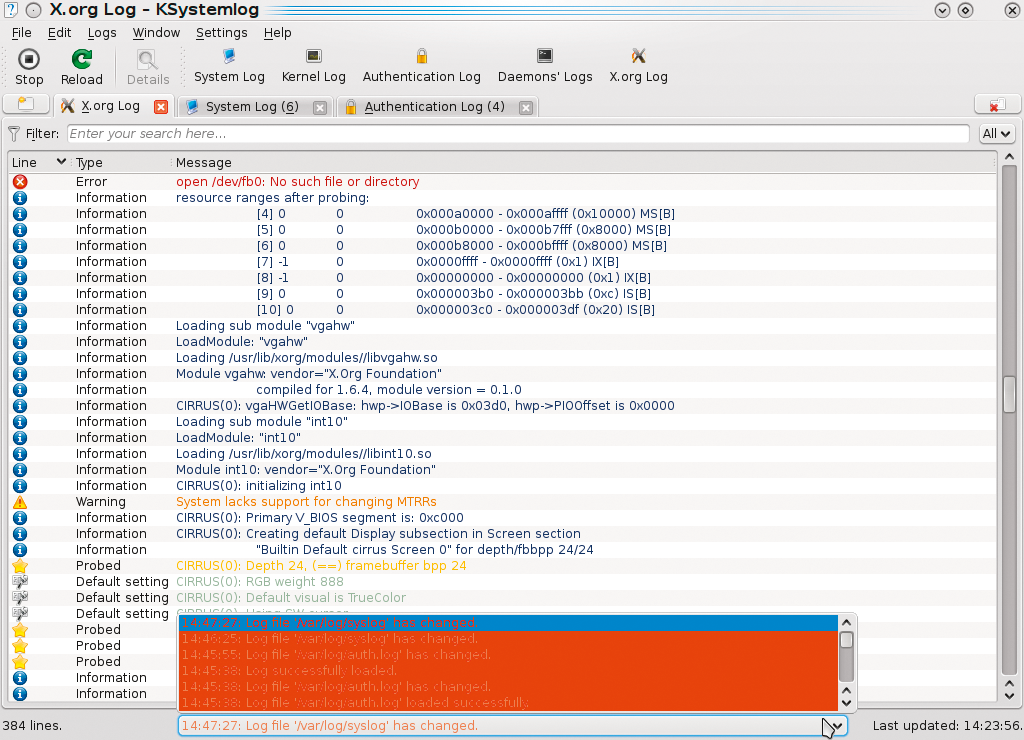
KSystemLog can open multiple logfiles at the same time and organize them in tabs. For this to happen, you first need to press Ctrl+T and create a new tab; then you select the required log. When the viewer refreshes a logfile in the background, it shows you the number of new lines in brackets next to the tab name. Additionally, the tool displays a drop-down menu at the bottom of the window telling you which log was updated and displaying the new lines with color highlighting (see Figure 1). Unfortunately, the program doesn't remember which tabs you opened with which logfiles. So, the next time you launch KSystemLog, you have to reopen the tabs and logfiles and set them up again.
One of KSystemLog's neatest gimmicks is its support for multiple date formats. You can use the program's general settings to choose between a short or long display format. And, for both variants, you replace the numerical date with Today or Yesterday (as opposed to "long names").
At this point, a minor weakness in KSystemLog is revealed: If it runs without interruption beyond midnight, you need to reload the logfiles to avoid confusion.
This viewer follows the general philosophy of the Gnome desktop environment: More is not always better. When it comes up, the tool is spartan but fast and functional. The logfile name is shown in the sidebar on the left, with the content displayed on the right. In this text box, users can scroll and highlight to their heart's content without being distracted by cryptic menu entries or garish icons. Pressing F9 hides the sidebar, giving the Gnome System Log Viewer the feel of a text editor.
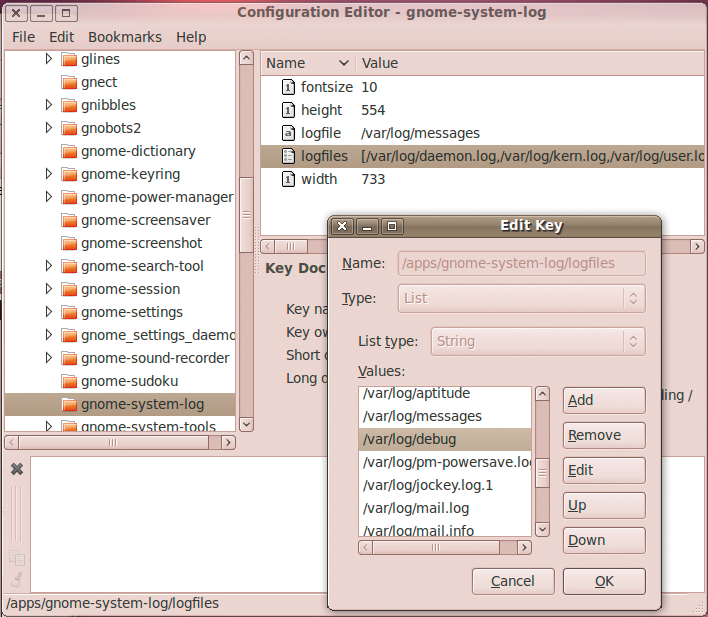
The selection in the area on the left is huge, but if your favorite logfile is missing, you can use the file browser to locate it. The Gnome tool remembers the logs you added manually when restarted, making it worthwhile to customize. You can close logfile views by pressing Ctrl+W, but don't look for a setup dialog for organizing or editing existing entries. The approach here is via the Gconf editor, in which the /apps/gnome-system-log section gives you access to the various keys (see Figure 2).
The Gnome System Log Viewer also gives you a live view that automatically refreshes the display. When new entries reach the logfile you are viewing, the tool jumps to the lines in question and highlights them in bold type. In contrast to KSystemLog, you cannot disable this behavior. If something happens in one of the logfiles, the Gnome tool discreetly draws your attention to it by highlighting the log name in the sidebar. The label doesn't revert to the normal display until you have checked the updated log.
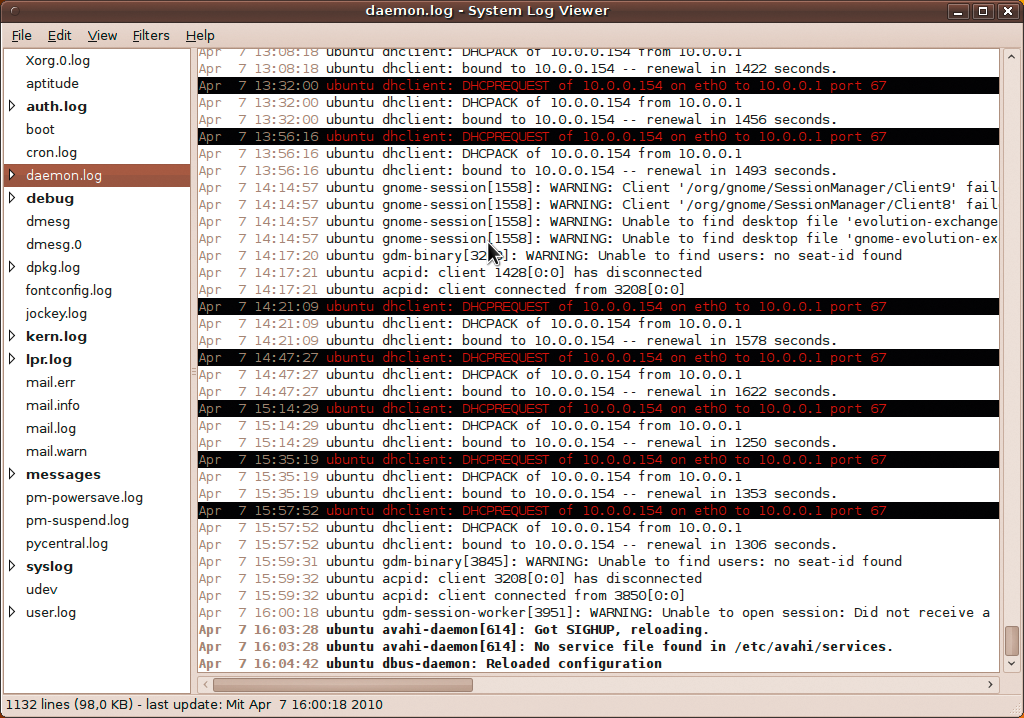
The Ctrl+F shortcut displays a search bar below the text box. Additionally, you can define some filters in the filter menu. In the dialog this displays, you can then define rules to highlight (Figure 3) or hide individual lines. Regular expressions are supported here. Once set up, the filter rules can be enabled individually as subitems in the Filter menu.
Working with the Gnome System Log Viewer is enjoyable because the tool only highlights the date in the area on the right and otherwise displays the logfiles as is. This rules out incorrect parsing of some logs. Logfiles whose timestamps the tool has identified will appear in the bar on the left as expandable entries. Then you can click to sort the entries by day.
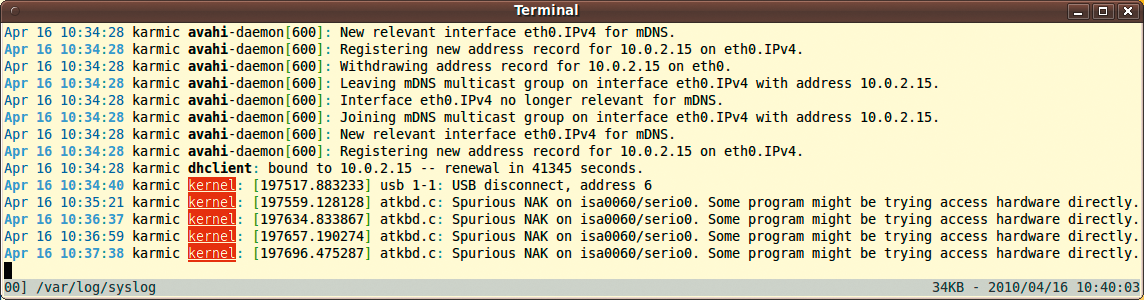
The logfile viewer for the command line might appear hard to use at first glance, but it soon reveals itself as a powerful tool that gives admins unlimited possibilities for log analytics. When launched, MultiTail expects you to pass in a number of details, such as the log name (multitail /var/log/messages). The tool will then show you the latest entries from the selected file. The viewer highlights some keywords (see Figure 4).
Hitting F1, H, or Ctrl+H will display a window in the terminal with details of the available shortcuts. B opens a subwindow for scrolling. In this view, you can press B, the arrow keys, or use the mouse wheel to navigate. While you are doing so, the log display continues to run in the main window, keeping MultiTail up to date at all times. Pressing Q quits the subwindow, as well as the program itself.
The keyboard shortcut / (that's simply a slash) opens MultiTail's search function. Again, the viewer gives you a separate window for this so that the display will continue to update in the background.
MultiTail color codes logfiles for ease of viewing with color schemes defined in /etc/multitail.conf. If you don't like the program defaults, you can either define the color scheme in the setup file at run time (press C) or when launching the program (-cS scheme). Also, you can combine multiple schemes, which makes sense for logs like /var/log/messages that contain messages from various services.
If you find the huge range of options described by the man page daunting, check out the examples on the website [4]. The "MultiTail Hands On" box also gives you two examples of advanced use. After setting up MultiTail to meet your requirements, you can press W to generate a one-line shell script that automatically sets the tool to your preferred state when launched.
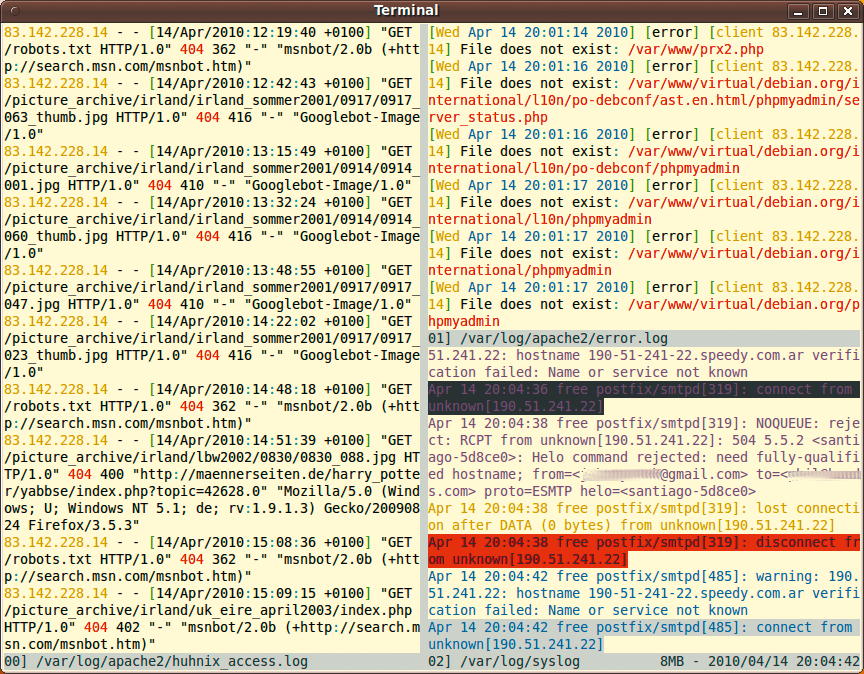
As mentioned earlier, MultiTail can display multiple logfiles simultaneously. The viewer is flexible and will also accommodate messages from external programs like ping, tcpdump, or strace. You can also mix the displays (merge function) or tile the main window horizontally or vertically (Figure 5).
Combinations of these view options are allowed. This makes it possible to combine logs and related program output. If you plan to modify the system and want to monitor the effect quickly and easily in the logfiles, pressing the Enter key gives you an additional overview. MultiTail then creates a thick red line with the date and time in all of its windows - a useful dividing line between the before and after states.
Critics might argue that MultiTail is overkill, in that most of its functions are covered by legacy Unix tools, but the flexible view options are impressive when you have found the perfect setup.
| MultiTail Hands on |
|
The following two examples show how MultiTail can quickly help administrators with analysis and troubleshooting. In the first case, the administrator uses the viewer to investigate a web server that seems to be having problems accessing various pages. The administrator launches MultiTail in a large terminal window for a better overview with the use of the following command: multitail -sw 100,20 /var/log/apache2/access_log -I /var/log/apache2/error_log -L "tcpdump -q -i lo port http" -kS 'TCP (.*:http.*)$' -ev '^COMMAND' -l "lsof -r 1 -i TCP:http" The larger part of the window now displays the web server messages combined with the TCP packets that are sent. The narrow column on the right shows whether the web server is actually listening on its assigned port. You can easily see that the web server doesn't send any data if a certain page is in the referrer. The admin can now check the referrer's spam settings to see if they are restrictive. The second example shows MultiTail using a script to include a filter. The script tells the viewer to display the calendar week and the weekday name. The script itself ( multitail -o 'convert:weekday:script:./weekday.rb:^([[:space:]]*[[:alnum:]]{,3} +[[:alnum:]]{,3} +..:..:..)' -cv weekday /var/log/syslog
Of course, MultiTail will work with Bash, Perl, or other scripting languages, as long as they are executable. |
| Listing 1: Script weekday.rb |
01 #!/usr/bin/env ruby
02 require 'date'
03
04 STDOUT.sync = true
05
06 STDIN.each_line do |date|
07 puts DateTime.parse(date).strftime ('W%W %A %T') + "\n"
08 end
|
All three of the programs investigated fulfill their tasks satisfactorily. If you just need a quick view of your logs, the Gnome System Log Viewer would be the right choice. The viewer focuses on the bare necessities, without cluttering the screen with needless colorful icons or too much information. The only drawback is the extended launch times, which is a factor because the tool updates the view between each change.
KSystemLog has useful highlighting and, above all, the ability to organize multiple logfiles in tabs. However, it is a pity that the tool doesn't remember the logfile tabs after quitting. This actually makes it useless for power users, but it will provide good service if you simply want to take a closer look behind the drapes from time to time.
MultiTail closes this gap and combines the frugality of the Gnome tool with the flexibility of the KDE viewer. Its interactive controls take some getting used to, but the tool impresses with the ability to store settings, a choice of view modes, and its ability to cooperate with external programs and scripts.
| INFO |
|
[1] KSystemLog: http://ksystemlog.forum-software.org
[2] Gnome System Log Viewer: http://library.gnome.org/users/gnome-system-log [3] MultiTail: http://www.vanheusden.com/multitail/ [4] Examples of MultiTail command lines: http://www.vanheusden.com/multitail/examples.html |
| AUTHOR |
|
Andrej Fink lives in Vienna, where he is studying mathematics at the Vienna University of Technology. Linux has been his choice of operating system since 1999. He is the sys admin for various organizations and is currently exploring virtualization, configuration management, and behavior-driven infrastructure, all of which generate a huge number of logs. |