
vtop is a graphical activity monitor for the command line. In this article, I take you through how I wrote the app, how it works underneath and invite you to help extend it.
System monitoring tools have been with us since the early days of computing, but on the terminal, many people still use the top command. Now, let me introduce you to my open-source activity monitor called vtop. It uses Unicode Braille characters for richer visualization on the command line.
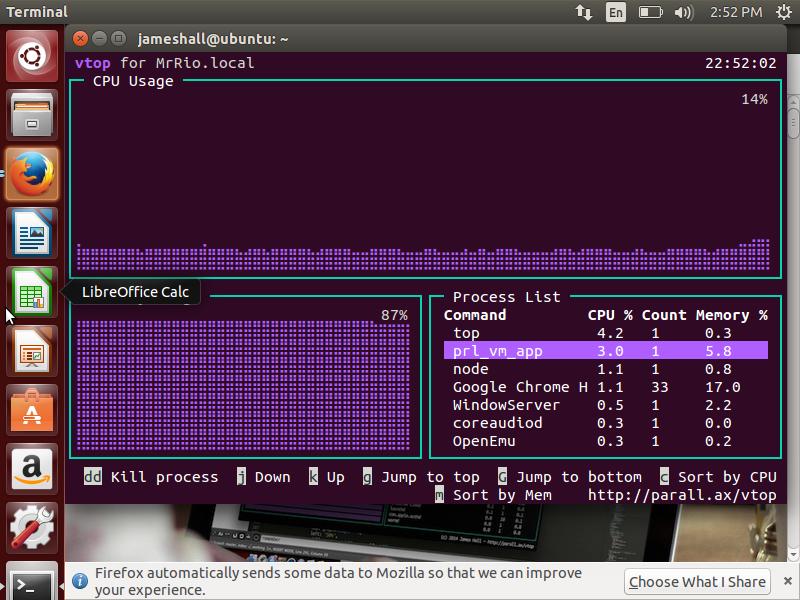
Figure 1. vtop Running on Ubuntu
For many, the top command has been a key way to monitor rogue processes on *nix systems. William LeFebvre wrote the original top command more than 30 years ago on a Vax running BSD UNIX. He was inspired by the Vax VMS operating system that listed the most CPU-hungry processes along with an ASCII bar chart. The bar chart didn't make it across into his version; the author went instead for a text-based approach to displaying data that has stuck with us.
While the GUI-world enjoys increasingly feature-rich tools, terminal applications sadly have lagged behind. Graphical representations in system monitoring tools are nothing new. KSysguard and GNOME's System Monitor sport fancy graphs and charts, but this isn't much use to us on the command line.
Although there's absolutely nothing wrong with top's text-based approach, it's not what I needed when I set out to write vtop. The original vtop was a quick hack, mostly written in a day, and like all the best open-source software, it scratched an itch. I needed to see CPU spikes to debug some strange behaviour, and I couldn't use the graphical tools for Linux, because I didn't want to install all that bloat on my servers. Just looking at the numbers in top doesn't give you much of an idea of how it's fluctuating over time.
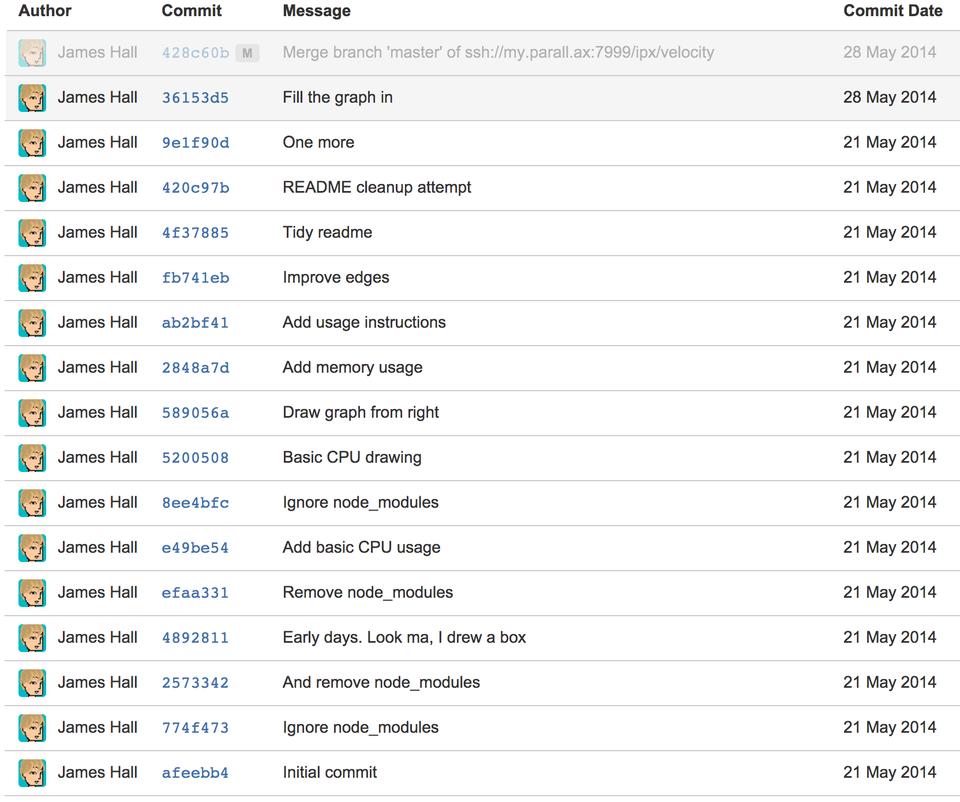
Figure 2. A Flurry of Early Commits
I started hashing out the initial version, not worrying too much about the tidiness of the code (I was trying to debug a problem quickly after all). I ended up getting carried away with it, and I almost forgot to go back and debug my original issue.
I ran the code on the remote server and was delighted at how immediately useful it was, even in its crude and ugly form. I committed the code and showed it to my colleagues at work. The reaction was a mixture of delight (“How do you even do that?”) and horror (at my sloppy programming <blush>), but I knew this idea had legs.
Worrying too much about the architecture early can be a waste of time. It's usually best to write one to throw away, and this code base certainly needed binning. The best structure for the application was far more obvious once I had a working prototype.
I sketched out what I thought it should look like: a large area at the top for CPU usage, then two smaller boxes for memory and a process list. I started a new project and got to work.
I decided to write vtop using Node.js. It's built on Chrome's V8 JavaScript engine and allows you to write fast and scalable applications. This choice could pave the way for a Web-based front end to be added in the future. JavaScript is coming into its own—it's no longer the scrappy, badly implemented language that everyone used to make sparkles follow their cursors on their Geocities pages. Node.js has evolved the language—it's now a fully formed toolchain with a thriving community. There's a Node package for just about anything you can think of; you really can hit the ground running by picking up other people's modules instead of writing from scratch.
At the beginning of the rewrite, I made an outline using simple box drawing characters that I used to love playing with in my early DOS programming days. Although this worked okay, I felt there might be an easier way. I'd seen ncurses and wondered if there was anything more modern kicking about. I eventually came across Blessed.
Blessed abstracts away the complexities of drawing a GUI in the terminal. You tell it where to draw boxes, and they are resized automatically based on the terminal width and height. You also can listen to scroll wheel and click events to enable even easier interaction. I highly recommend checking it out.
I created a couple boxes in Blessed and populated the text content of the first one with the Braille characters. Then I easily was able to add different colors to the app.
The rewrite forced me to think about my design goals for the project. I was keen to have other developers get involved, and hopefully, it can be used for purposes I never imagined. The design goals can be distilled to these three:
Extendible: plugins should be easy and quick to write, with clear separation of UI code and data collection code. (There's still a little work to do in this area.)
Accessible: when it comes to servers, the terminal rules the roost, and nothing beats the convenience of being able to dive straight in over SSH and fire up a command. That's not to say that a Web-based GUI would be unwelcome, but each feature should work from the command line too.
Visual: it should take advantage of the latest and greatest techniques—a visually appealing interface using color and Unicode characters to great effect.
Terminals have come a long way since the early days. xterm added 256-color support (which is just a sequence of escape codes printed out as text) and mouse support (which is your terminal sending text escape codes). Pretty much all terminal emulators support Unicode now, and in vtop, we use this to our advantage.
Unicode Braille characters give you a convenient 8x2 grid of dots in every possible combination, starting at Unicode point 0x2800. We can use these as faux-pixels. You take a grid of coordinates, and break it up into chunks for each character, and then just output them to the screen like you would any other text. There are 256 combinations (two states—on and off for each of the eight dots, which is 28), and you can calculate which character you need by combining the hexadecimal numbers for each Braille dot and adding that to the starting point. Below are Braille Characters Representing a Slope on a Graph:
.
..
.. .
.. ..
See jsfiddle.net/MrRio/90vdrs01/3/.
Figure 3. Hexadecimal Values for Each Braille Dot (Public Domain)
For example, the first character above would be 0x1 + 0x2 + 0x4 + 0x40 + 0x10 + 0x20 + 0x80 = 0xF7, then add this to the base of 0x2800 to get 0x28F7. You can try this in your browser's JavaScript panel:
String.fromCharCode(0x1 + 0x2 + 0x4 + 0x40 + 0x10
 ↪+ 0x20 + 0x80 + 0x2800);
There's a brilliant Node.js library that abstracts away this detail for you called node-drawille. It allows you to plot onto a canvas and returns Braille characters using the same method described here.
The main feature is the graphical interface, but it has a few other tricks up its sleeve:
Vim-like keybindings: if you use vim, your muscle memory is tied to its keyboard shortcuts. Type j/k to move up and down the list and h/l to change the scale on the graphs. The arrow keys work fine too!
Grouped processes: vtop will group together processes with the same name. Many applications are multiprocess—for example, Google Chrome spawns a new process for each tab to increase stability and security. You can get a true overall value of the CPU percentage it's taking up. It's also great for monitoring Web servers like Apache and nginx.
Killing processes: simply type dd to make a process die. This is also the vim shortcut for deleting a line.
Sorting by CPU or memory: typing c will sort the list by CPU; no prizes for guessing which key you press to sort by memory.
Simply install npm with your favourite package manager. Then to install the command globally, just type:
npm -g install vtop
Upgrade notifications appear within the application, and it can be upgraded with a single key stroke.
Getting Started with the Codebase:
First off, start by forking the project on GitHub: https://github.com/MrRio/vtop.
One you've got your own fork, you can clone the source from GitHub (make sure to replace “MrRio” with your own GitHub user name):
git clone git@github.com:MrRio/vtop.git
cd vtop
make
./bin/vtop.js
The last command runs your development version of vtop rather than the globally installed one.
Now you can begin hacking with the code.
To give you an idea of where to start, let me guide you through the main areas of the application. The entry point for the application is bin/vtop.js. This is a hybrid JS file and shell executable. It first runs as a shell script, detects the name of the node executable (which differs depending on the platform), enables xterm-256color and then runs itself as JavaScript. It then includes the main app.js file in the root.
Then the app.js file loads in the required libraries, the most important of which are Drawille for the Braille output, Blessed for the GUI and commander, which is used to parse command-line options. It then globs the themes/ directory for a list of themes and loads itself up via the init() function.
drawHeader is responsible for drawing the title bar, with the time and any update notifications.
drawFooter prints all the available commands across the footer and a link to the Web site.
drawChart is responsible for drawing Braille charts, and drawTable for the process list, although this could do with refactoring into new files to allow for more display options to be contributed.
Sensors are loaded in from the sensors/ folder and polled at the desired frequency. Then the draw methods take this data and push it on to the screen.
Themes:
A theme is a simple JSON file containing foreground and background colors for each element. Simply bob your theme into the themes/ directory, and then run vtop -theme yourtheme. Send a Pull Request, and as long as it isn't too similar to another theme, we'll include it.
The themes files are broken up per component and handed straight over to Blessed's style parameter for each component. It's possible to change the characters used for the box lines, or even add bold and underline (check out the Blessed documentation at https://github.com/chjj/blessed for more information):
{
 "name": "Brew",
 "author": "James Hall",
 "title": {
  "fg": "#187dc1"
 },
 "chart": {
  "fg": "#187dc1",
  "border": {
   "type": "line",
   "fg": "#56a0d1"
  }
 },
 "table": {
  "fg": "fg",
  "items": {
   "selected": {
    "bg": "#56a0d1",
    "fg": "bg"
   },
   "item": {
    "fg": "fg",
    "bg": "bg"
   }
  },
  "border": {
   "type": "line",
   "fg": "#56a0d1"
  }
 },
 "footer": {
  "fg": "fg"
 }
}
Sensors:
vtop currently has three sensors, CPU, Memory and Process List. A sensor has a title, a type (which decides the kind of renderer to use), a polling frequency with a function and a currentValue. The sensors know nothing about the UI, and their sole job is to output a single number or a list for the table type. vtop then takes this information and plots it out.
Sensors may need extending with more properties and methods depending on the kinds of things people want to build with them. For example, an Apache req/s sensor may need to be able to report its largest value, so vtop can adjust the scale, or the memory sensor could be extended to report multiple values for used, buffered, cached and free memory.
The following is an example sensor file—as you can see, they're pretty straightforward to write. Why not try modifying the file to have it report something else:
 /**
 * CPU Usage sensor
 *
 * (c) 2014 James Hall
 */
var os = require('os-utils');
var plugin = {
 /**
 * This appears in the title of the graph
 */
 title: 'CPU Usage',
 /**
 * The type of sensor
 * @type {String}
 */
 type: 'chart',
 /**
 * The default interval time in ms that this plugin
 * should be polled. More costly benchmarks should
 * be polled less frequently.
 */
 interval: 200,
 initialized: false,
 currentValue: 0,
 /**
 * Grab the current value, from 0-100
 */
 poll: function() {
   os.cpuUsage(function(v){
     plugin.currentValue = (Math.floor(v * 100));
     plugin.initialized = true;
   });
  }
};
module.exports = exports = plugin;
If you have a basic understanding of JS, you can see how simple building a sensor really is. If you can give vtop a number, it can plot it. You could get these from existing npm modules or by parsing output of other Linux command-line utilities.
There are many tutorials on the Internet for getting started with Git (the git-scm.com Web site is good). It's much less scary than you think.
For features, simply make a branch called “feature/name-of-feature” and for bugfixes, “bugfix/name-of-fix”. Don't worry about getting it perfect first time. Send your code in early for feedback, and people will help you refine it and get the code into the master branch.
I look forward to seeing what you come up with!
There's more than one way to skin a cat, and this is especially true on Linux. I've rounded up a few of my favorite monitoring tools outside the usual top command. Some of these tools even may be easily integrated into vtop as sensors.
htop:
This is a feature-rich interactive process viewer and has been around for years. The author tweeted me to ask if he could use the Braille graphing idea. I'm very excited to see how this develops (https://twitter.com/hisham_hm/status/477618055452037120).
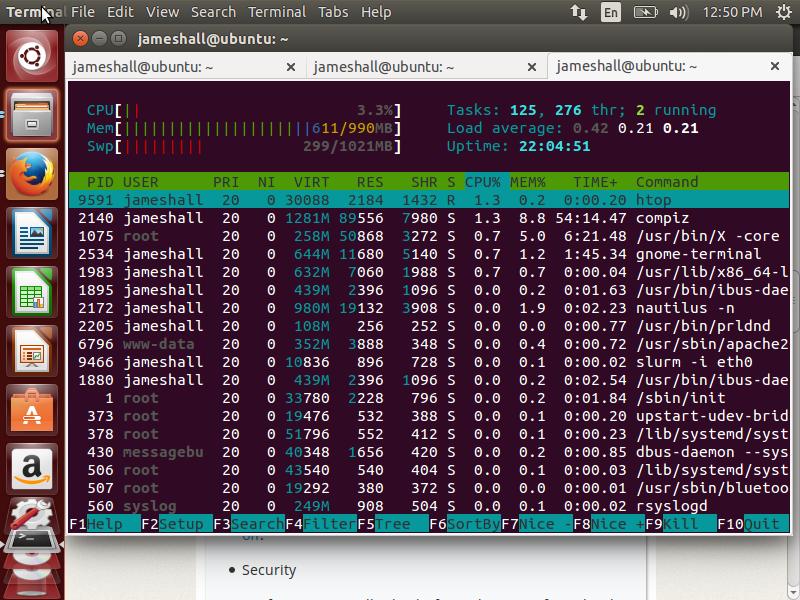
Figure 4. The htop Interactive Process Viewer
iotop:
This is a great tool for measuring applications that are hammering your Input/Output. It calculates the number of bytes used. It's written in Python and parses information out of /proc/vmstat.
netstat:
This ships as part of Linux and Windows, and it allows you to see all open connections. It's often useful to pipe this command into more:
netstat | more
apachetop:
This parses Apache (and Apache-compatible) log files on the fly to give you real-time requests, per-second stats, most popular pages and more. It's very handy for monitoring AJAX and other Web requests that aren't tracked in your favourite Web-based analytics.
NetHogs:
This a great tool to see where all your Internet bandwidth is going. It lists each hog individually by KB/sec. It doesn't require you to load any special kernel modules—just fire it up and find the offending process straightaway.
Slurm:
This tool helps you visualize network activity on your system by plotting red and green “x” characters.
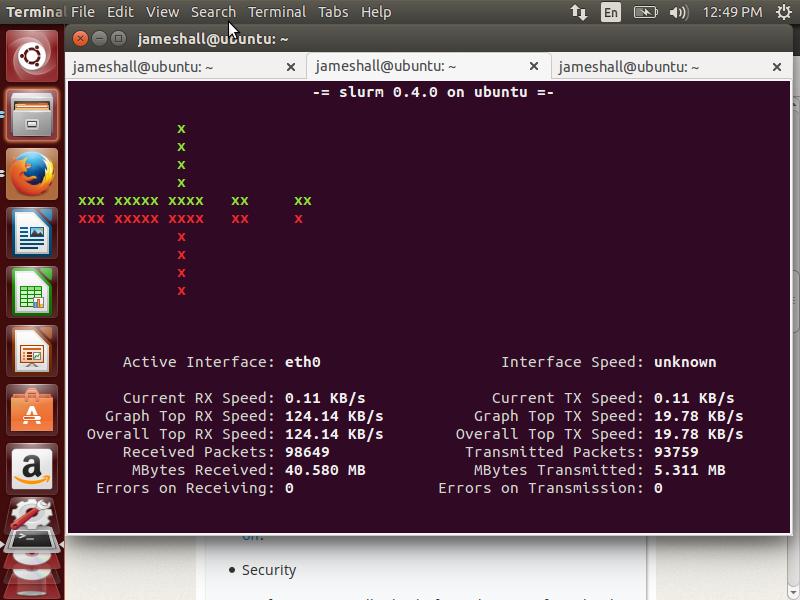
Figure 5. Slurm
It's time to think more about how our computers can represent data over time, and how we can use tools that are more visual than top. What do you want from a system monitor? Do you need to see what's going on inside an app? Do you need to see the number of Web server requests, the temperature of sensors or the throughput of a database server? What other visualizations could be done with Braille or other characters?
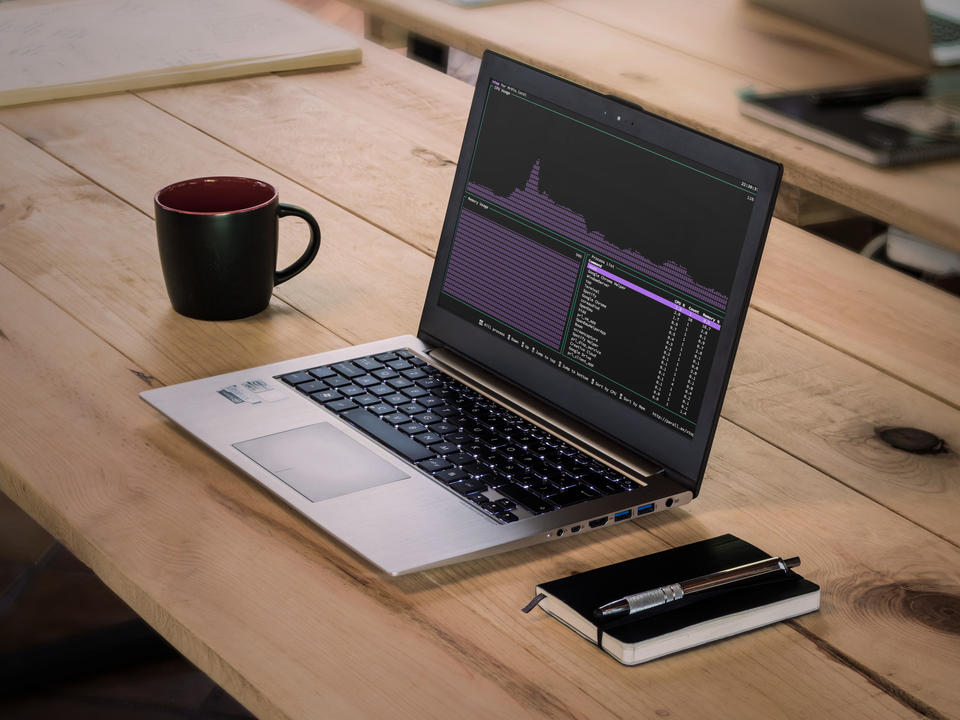
Figure 6. How can you help build vtop?
Roll up your sleeves, and let's make something cool!