
By David Nalley
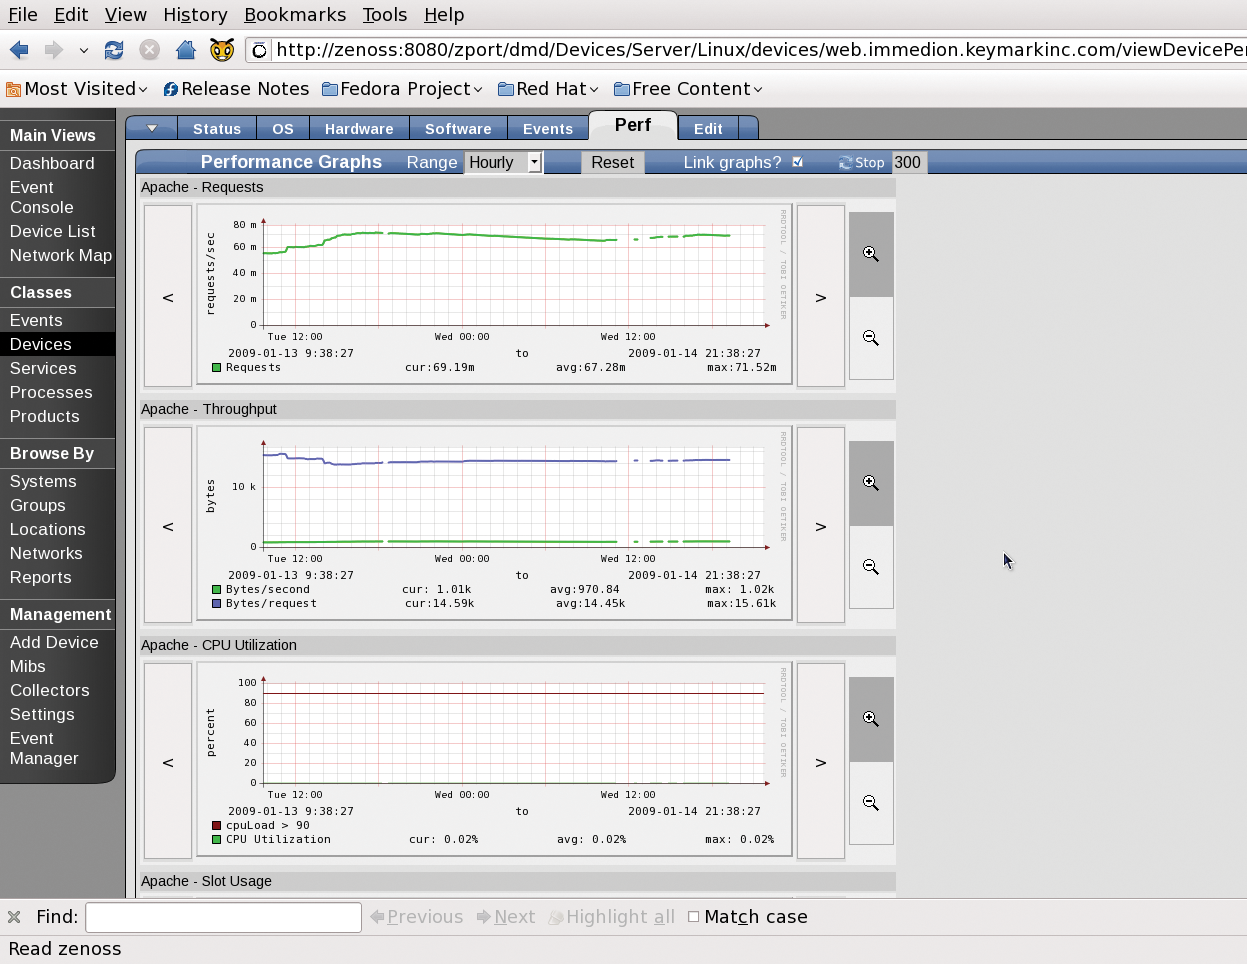
With a convenient web interface and a flexible design, the Zenoss monitoring tool is winning converts around the world. Zenoss has an impressive list of features that seem to grow every month. The tool does a great job as a status monitor, and it even supports Nagios plugins. The Zenoss system is also good for monitoring performance and trending (Figure 1). The tool comes stocked with defaults for various types of devices, such as Linux boxes, switches, routers, and even Windows machines, and additional features are easy to add. In the grand tradition of *nix environments, Zenoss is designed with a modular architecture. To add new functionality, just plug in a new module (a ZenPack, in the parlance of the Zenoss masters).
One function I find especially useful is Zenoss' syslog server. Zenoss will take standard syslog output and act as a syslog server. This means that, in addition to checking status and monitoring performance, you can also view log information, which is often the best way to see cause and effect. Your Windows machines aren't left out of the logging loop either because Zenoss handles Windows event logging via WMI (Windows Management Instrumentation.
Zenoss supports monitoring and management technologies such as SNMP, WMI, ping, portscan, and ssh-based monitoring.
SNMP is the defacto standard for garnering network information, and virtually all computing or networked devices support SNMP.
For devices that don't use SNMP or WMI, or that are beyond the access of conventional monitoring tools, you can perform limited network tests with ping- or portscan-based monitoring.
Monitoring via ssh lets Zenoss connect to a machine and execute commands to determine a machine's status.
| Network Monitoring Options |
|
Network monitoring occurs for a number of reasons, but the most common is the desire to know when something goes awry. In addition to watching for failures, monitoring can also help predict a failure or avoid an unwanted event. Knowing, for instance, that the disk on your mailserver is at 95% of its capacity permits you to add more disk space before a problem occurs. Another benefit of network monitoring is that it helps you plan growth. For instance, trending that looks back in time and provides historical data will let you know that mail is increasing by 10% a month and that, in n months, you will need a new mail server. Historically, monitoring applications have focused on one of three areas. Status monitoring is the most well known form, particularly since Nagios has appeared as an important status-monitoring application. Status monitoring essentially answers yes or no to questions like, "Is the mail daemon up?" This functionality is the core of most network management systems. Performance monitoring, or trending, is the next most common type of monitoring, and RRDtool is the performance application that immediately jumps to mind. A performance monitor tells you that your CPU has been at 20% utilization for the past 6 months but has suddenly increased to 80% over the past week. This information is particularly useful for gauging things like bandwidth usage. The final form is log monitoring. Virtually all applications generate logs that provide insights into what is happening and what is going wrong. These tools together are a network monitoring system. |
Zenoss offers several avenues for communicating network information. The first option is the web interface. The most useful view of what is happening on your network is the Event Console (Figure 2), which provides an interface for viewing and configuring monitoring events.

Most people, however, are not likely to be watching the event console all of the time. Thankfully, Zenoss can push out alerts to SMS and email. What's really fabulous is the granularity you can apply to alerts. For instance, a mail admin might want to know about a problem with a mailserver anytime, but other network problems only during the business day. Zenoss makes it quick and easy to configure a range of alerts for a range of different events.
Another Zenoss tool for viewing network data is a desktop applet called Zapplet. This applet provides status and event information in your system tray. Zapplet runs on just about anything that supports Gtk2.
To set up Zenoss, use either a stack installer or distribution-specific packages. In addition, Zenoss is available in source code, and a virtual appliance is available for VMware.
The stack installer includes dependencies such as MySQL, and it comes with a nice GUI installer that prompts you for the necessary information; however, the stack installer doesn't provide some of the benefits of working through a package management system.
Most of the Zenoss community installs occur on Red Hat Enterprise Linux 5 or CentOS 5 systems. The preferred means of setting up Zenoss on a Red Hat-based system is with the RPM packages.
The Zenoss website [1] has the latest version for download. After you obtain the RPM, execute the following command as root:
yum localinstall --nogpgcheck ./zenoss-<version>.rpm
Once Zenoss and its dependencies are installed, you need to enable and start MySQL:
/sbin/service mysqld start
/sbin/chkconfig mysqld on
Because Zenoss must communicate with other servers, you need the following ports:
Starting Zenoss will initialize the database. One word of caution: Zenoss assumes that the MySQL root user password is blank and that the database server is running on the same machine. If this isn't the case, you need to edit the /opt/zenoss/bin/zenoss_init_pre file. Having the database on the same machine as the monitoring system is a bit controversial.
Experts often recommend running the database server on a dedicated host. However, with a monitoring system that stores events in the database, putting the database on a separate system introduces an additional point of failure.
To initialize the database and start Zenoss, enter the following command:
/sbin/service zenoss start
To connect to the web interface, point your browser to http://<ipaddress-ordnsname>:8080. The default username is admin and the password is zenoss.
Before you can start monitoring with Zenoss, you need to make sure net-snmp is installed on the system:
yum -y install net-snmp
To set up a minimal configuration file, type the following as root:
echo 'rocommunity zenoss <ipaddress>' > /etc/snmp/snmpd
This line permits the IP address of the Zenoss box to connect to the SNMP daemon running on the Linux server, defining the read-only community name zenoss.
Next, you must open port 161 UDP on the machine you want to monitor. Finally, you need to start the SNMP daemon and set it to start on boot with:
/sbin/service snmpd start
/sbin/chkconfig snmpd on
Within the web interface of Zenoss, click on Add Device in the lower left-hand corner (Figure 3) and enter at least the following:
Click on the Add Device button to start collecting data. Although SNMP is the preferred monitoring protocol for Zenoss, you can change it on the Add Devices page. Note that defining the device class is crucial. Zenoss changes what it monitors on the basis of the device class.

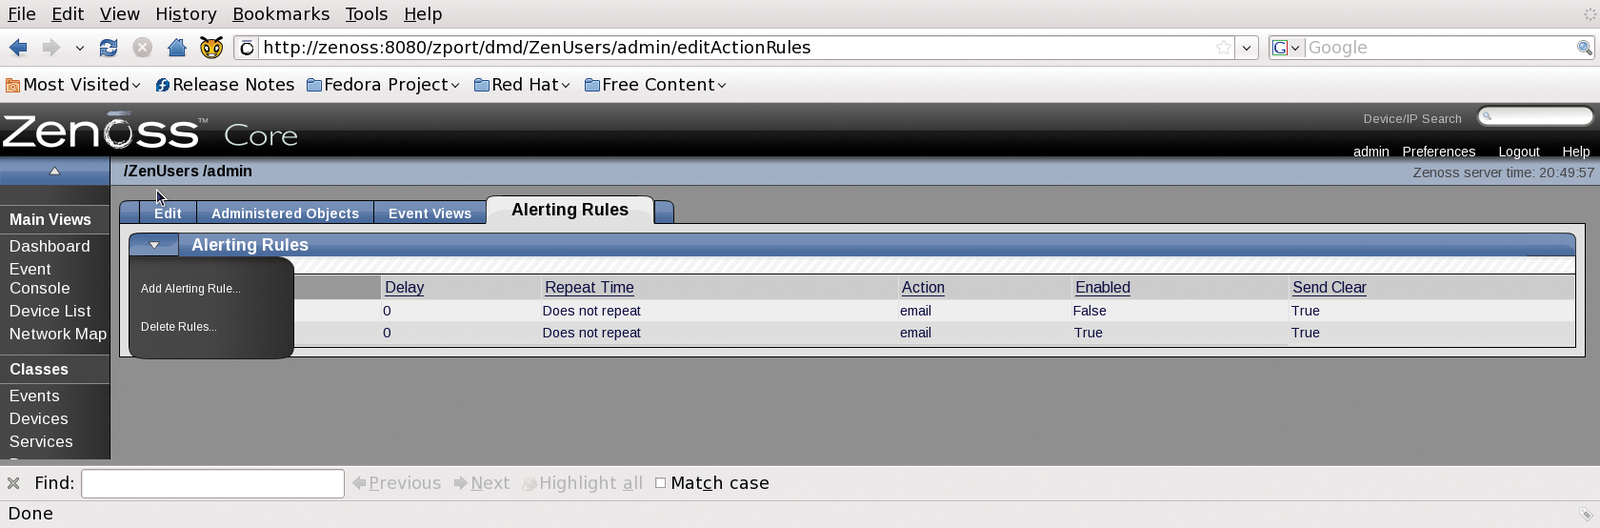
Some monitoring events might already be defined in the Event Console - for instance, to alert you about misconfigurations. To see the event list, click on the Event Console link in the upper-left corner. To add alerts for additional events, click on the Settings link under Management on the left hand menu, then choose the Users tab. Select a user, then click on the Alerting Rules tab (Figure 4). In the Alerting Rules menu, choose Add Rule and provide a name for the rule. After clicking OK, click on the rule that specifies where and how messages are sent, if delayed, and finally, what criteria are used for determining which messages are sent. A single rule can handle a wide swath of alerts, whereas more finely grained alerts might require multiple rules.
| Monitoring a Windows Client |
|
Monitoring a Windows machine also requires preparation on the client side. To begin, you need to install the SNMP service by selecting Start | Control Panel | Add/Remove software | Windows Components | Select SNMP. Unfortunately, Windows SNMP is severely limited. Zenoss recommends use of the free SNMP Informant add-on instead. Also, you need to configure the SNMP daemon. To do so, right-click on My Computer and select Manage. Then choose Services, select SNMP Service, right-click, choose Properties, choose the Security tab, add your selected community name, and define it as read-only. To configure which service accepts SNMP packets from specific hosts, add an entry for your Zenoss server. Now start the service and ensure that it is configured to start automatically on boot. In addition, you'll need to open UDP port 161 so that Zenoss can connect with the Zenoss daemon. Within the Zenoss web interface, click on Add Device, enter the IP address or hostname, choose the class /Server/Windows, and specify the proper SNMP community string. Data collection begins when you click Add Device. Because Zenoss also is capable of monitoring via WMI, you should provide Windows credentials to permit collection: Click on Devices/Servers/Windows, choose the zProperties tab, and enter the data in the zWinuser and zWinpassword fields. Remember to prepend the domain if you are passing domain credentials. Entering the domain at the Windows server level means that each Windows machine will use these credentials. If you need a "one-off" configuration for a single machine, you can click on that device's zProperties tab to change the configuration. |
Many of the open source companies offer commercial versions that provides substantially different functionality. In the case of Zenoss, however, the primary difference between the commercial Enterprise version and Zenoss Core (the community version) is that Enterprise lets you benefit from some configuration that has been done ahead of time. For instance, one of the ZenPacks that comes with Enterprise is an Exchange monitoring pack. Zenoss clearly realizes that true Enterprise customers are paying for support, so providing faster configuration on the Enterprise version will minimize their use of internal resources.
| INFO |
|
[1] Zenoss download: http://zenoss.com/download
|