
Internalizing Dojo's “write once, deploy anywhere” philosophy, Dojo's gfx (pronounced “g-f-x” or sometimes “graphics”) library packs a powerful 2-D drawing API that's capable of plugging in to an arbitrary renderer. Out of the box, it works with Canvas, Silverlight, SVG and VML, so regardless of which browser your application is ultimately viewed within, gfx has you covered.
My article “Dojo: the JavaScript Toolkit with Industrial-Strength Mojo” in the July 2008 issue of Linux Journal illustrated how Dojo significantly lowers the amount of effort it takes to develop a cross-browser Web application by normalizing so many of the yucky aspects of Web programming, such as DOM manipulation, non-uniform aspects of the JavaScript across browsers, and repetitive tasks, such as styling nodes, performing AJAX requests and so forth. With that working knowledge, let's turn to Dojo's gfx library—a much more specialized aspect of the toolkit that's expressly designed to give you 2-D drawing tools that can be used to do anything from producing a cool-looking reflection of an image to creating an animated game to rendering a drag-and-drop graph.
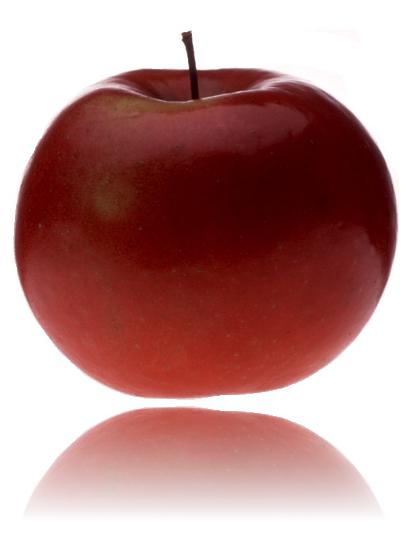
Figure 1. An example of a slick effect gfx can produce on an image.
So that you better understand exactly where gfx fits into the larger toolkit, recall that Dojo breaks down into roughly five components: Base, Core, Dijit, DojoX and Util. Base is the tiny dojo.js file that contains hard-live-without library code for common operations; Core includes most of the programmatic machinery for the toolkit; Dijit is an assortment of turnkey widgets; DojoX provides a collection of specialized subprojects; and Util provides a testing framework and scripts for tasks, such as minifying and consolidating JavaScript and CSS files. The gfx library is one of those many specialized subprojects that lives under the DojoX umbrella.
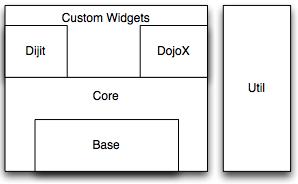
Figure 2. A Conceptual Portrayal of Dojo's Functional Architecture
In order to demonstrate the various drawing concepts as clearly as possible, all of the examples you're about to see will plug right in to the following minimal HTML page. Although you're encouraged to download the entire toolkit eventually, so you have full access to the source code whenever you need it, let's take advantage of the version that's hosted on AOL's Content Delivery Network, as it's quicker to get up and running. The latest version of Dojo at the time of this writing is 1.2, so the minimal effort to put Dojo to work is the following page, which uses a script tag to cross-domain load the toolkit:
<html>
  <head>
      <title>Minimal Development Template</title>
      <script
          type="text/javascript"
          src="http://o.aolcdn.com/dojo/1.2/dojo/dojo.xd.js">
      </script>
      <script type="text/javascript">
          dojo.addOnLoad(function() {
              /*Add Dojo-dependent logic
                here to avoid race conditions*/
          });
      </script>
  </head>
  <body>
  </body>
</html>
With the minimal template in place, it is trivial to load the gfx module and start drawing. The next section digs right in to various aspects of the API, but just so you can see where we're heading, consider the modification to the template that instantiates a 600x600 pixel drawing surface and draws a line from the upper-left corner to the lower-right corner shown in Listing 1.
Although quite simple, the previous example taught us that the origin of the drawing surface is the upper-left corner with positive axes extending down and to the right, and that you can place a drawing surface into an arbitrary page element. Although not directly stated, the latter implies that you can have multiple drawing surfaces on a single page.
It's also worth noting that the style applied to the div element in no way applies to the gfx surface that is created. Internally, what happens is that the surface is created and placed inside of the div; thus, the containing div exhibits a 600x600 size with a visible border around it, and the surface that is placed into the div just so happened to be 600x600 pixels also. Without using Firebug to inspect the DOM, that may not have been obvious, so hopefully, mentioning it here avoids any confusion.
An additional aspect of this simple demonstration that's important to note is that the browser was detected and a default drawing renderer was assigned automatically without any special intervention. In the case of a Gecko- or KHTML-based browser, like Firefox or Konqueror, SVG is used as the default renderer; Internet Explorer defaults to VML.

Figure 4. The gfx library's flexible design provides a uniform API that supplies a uniform abstraction on top of the most common drawing engines in the mainstream. Because it internally detects the drawing engine that's available, it works right out of the box.
Silverlight and Canvas can be configured to run on supported platforms via a gfxRenderer configuration switch supplied to djConfig via the script tag that loads Dojo into the page. For example, to instruct Firefox to use Canvas as the renderer you would provide the following script tag:
<script
    type="text/javascript"
    djConfig="gfxRenderer:'canvas'"
    src="http://o.aolcdn.com/dojo/1.2/dojo/dojo.xd.js">
</script>
The gfx API exposes a number of intuitive functions for common operations, such as creating rectangles, circles, lines, polylines and paths that are loosely based on the SVG standard as well as a set of custom attributes, such as stroke, fill color, rounded corners and more. Most of the methods support “chaining syntax”, which allows you to operate on the results of the previous operation repeatedly, leading to crisp code and clean syntax, so long as you do not abuse the device (Listing 2).
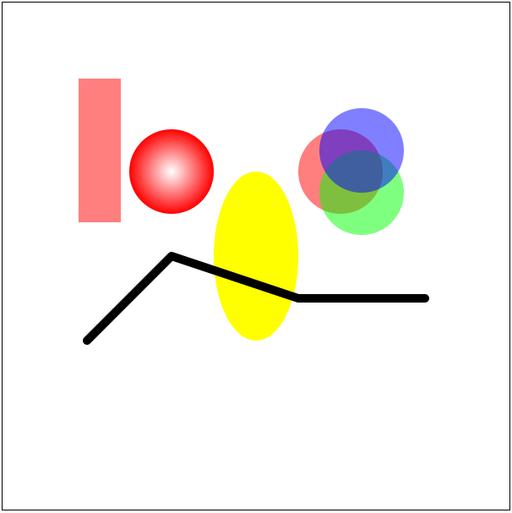
Figure 5. Dojo's fairly intuitive gfx API makes drawing a variety of customized elements easy and fun.
Hopefully, the code mostly speaks for itself. The various types of objects that you can create are usually framed in the same way that they are presented in grade school. For example, a circle has a center point and a radius defined by cx, cy and r. Given a circle, you could set a fill color in a number of different ways: a string value, an rgb(a) tuple or even something more complex like a radial gradient with custom parameters of its own.
Using a well-designed API with nice mnemonic devices is useful for much of the routine drawing you'll be doing, but what about when you need to do something a lot more in depth? Although this is where a lot of JavaScript graphics libraries fall short, gfx absolutely shines here by equipping you with the ability to perform arbitrary 3x3 matrix transformations.
Just in case you don't have a background with graphics, it may not be immediately apparent how 3x3 matrices and “all of that math” is useful. Basically, 3x3 matrices provide a compact way to express the three common operations that you do with objects all at the same time:
Translation: adjusting the position of an object in the x and y directions.
Rotation: adjusting the position of an object in the clockwise or counterclockwise directions usually (but not necessarily) around its center point.
Scaling: adjusting the size of an object by a scalar multiplier.
Don't freak out quite yet if you're not a math buff and don't want to sink time into re-learning linear algebra just to get started with that great idea you had for a game or drawing application. Many of the common operations for manipulating shapes come with intuitive wrappers. To illustrate a trivial example, let's assume that you want to draw a square but then rotate it around its center point so that it looks like a diamond:
dojo.addOnLoad(function() {
    var node = dojo.byId("surface");
    var surface = dojox.gfx.createSurface(node, 600, 600);

    rect1 = surface.createRect({
        x: 200,
        y: 200,
        width : 200,
        height:200
    })
    .setFill("red")
    .setTransform([dojox.gfx.matrix.rotategAt(45,300,300)])
    ;
});
With an upper-left corner at point (200,200) and a width and height of 200 pixels, the square originally was centered on the surface. Then, applying a 45-degree rotation around the square's center point of (300,300) rotated it in place.
To illustrate the effect of successively applying transformation matrices, let's draw the very same diamond but rely on explicit translation to position it in the center of the surface before rotating it versus positioning it via the createRect function:
dojo.addOnLoad(function() {
    var node = dojo.byId("surface");
    var surface = dojox.gfx.createSurface(node, 600, 600);

    rect1 = surface.createRect({
        /* x and y default to (0,0) */
        width : 200,
        height:200
    })
    .setFill("red")
    .setTransform([
        dojox.gfx.matrix.translate(200,200),
        dojox.gfx.matrix.rotategAt(45,100,100)
    ])
    ;
});
In general, it is immensely more convenient to draw most shapes initially in a coordinate system with perpendicular x and y axes and then apply final positioning via translation and rotation. An important technicality to be aware of with successive transformations, however, is that the order in which the transforms are applied does matter, and the original position of the object is normally the point of reference. For instance, in the previous example, the shape explicitly was translated as 200 pixels in the x and y directions, but its original center point from before the translation is applied serves as the basis of rotation.
If you're unconvinced that a shape as simple as a diamond would benefit much from the convenience of matrix transforms, just consider the extra work involved in calculating the exact coordinates for its corners, and you'll quickly see that it's easier to reason about “rotated squares” than it is about “native diamonds”.
It won't be long before you'll find that it's far more convenient to transform entire groups of objects instead of applying individual transforms to each object in the group. Let's consider the task of drawing a simple arrow that is nothing more than a line with a triangle on the end of it. Although you could use a path to construct the entire arrow, take a look at how groups can be useful by combining the results from the createLine function and the createPath function (Listing 3).
Attempting to calculate the three points for each of the arrows without the benefit of rotation quickly demonstrates just how laborious high-school geometry really can be; perhaps putting it to work with gfx makes it at least a little more interesting.
Because it's so common to want to interact with graphics, Dojo's gfx library has gone a long way to do most of the legwork for you in this use case as well. To wrap up some aspects of drawing, let's put together a little demonstration that draws a domino on the screen and then add drag-and-drop capabilities to it. As you're about to see, the laborious part of the effort is actually drawing something interesting enough that you'd actually want to drag and drop it. The actual mechanics of making it drag-and-droppable amounts to one whole line of code (Listing 4—note that the full code for Listing 4 is available on LJ's FTP site; see Resources).
Perhaps the ultimate test of an API is a few good examples of what you can build with it. One of the ultimate demonstrations of gfx's flexibility and power is Dojo's charting library, another DojoX subproject. A comprehensive introduction of the charting library would entail an article of its own, so until that time comes, you can find some great documentation on Dojo charting from the Dojo Key Links page. And, of course, you always can read over the source, which is located in the dojox.charting module of the toolkit's source code, if you want to get an idea of how much work goes into aligning labels, drawing tick marks and so on.
In addition to equipping you with many of the basic charts you'd want to use in a Web application, charting recently got a boost with a number of cool new features, including event support so that custom tooltips and animations can occur within charts—that kind of visual flair makes all the difference. To give you an idea of just how easy the charting API is to get up and running, consider the code blurb in Listing 5 that shows how to create a chart.
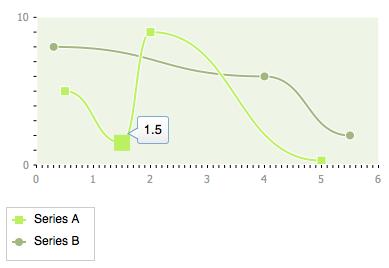
Figure 9. An example of the charts you can draw with Dojo—no Flash required!
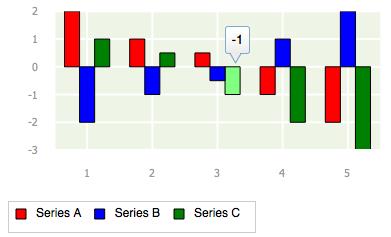
Figure 10. Another Example Chart Drawn with Dojo
Although only a teaser, it's worthwhile to note the charting API focus on charting—not on raw drawing operations—so you can focus on the semantics of the task at hand instead of the implementation details associated with lower-level operations. In general, you simply provide some data that says what kind of chart you'd like, how to customize the axes and pass in the series data. Setting up event handlers, legends and other related things all work much the same way.
2-D drawing is an enormous topic in and of itself, and no single article could cover all the nooks and crannies adequately. This article is designed to give you an idea of just how easy Dojo makes 2-D for the Web, which hopefully motivates you to start experimenting with the examples and check out the API docs.