
Using IBM InfoSphere Streams, Uppsala University can analyze massive amounts of data to help it model and predict the behavior of the uppermost part of our atmosphere and its reaction to events in surrounding space and on the Sun.
In 2006, the International Astronomical Union (IAU) decided Pluto was no longer a planet, but rather that it was a dwarf planet. Then in 2008, the same group decided Pluto was a plutoid instead of a dwarf planet. This year, the IAU met August 3–14 in Brazil, and while at the time of this writing, that hasn't happened yet, Pluto's official title is expected to come up once again.
One of the big problems with Pluto is that we just don't have enough information about it. Apart from some very distant images and behavioral observations, much of our Plutonian information is mathematical guesswork. If we turn our focus to the opposite side of the solar system, however, the dilemma reverses. The amount of information we can gather about the Sun is so great, it's difficult to capture it, much less do anything useful with the data.
On January 8, 2008, Solar Cycle 24 started. Although that might seem insignificant to most people, in about three years, it will be reaching its peak (Figure 1). Solar storms, or space weather, can have a very significant effect on modern society. These invisible outbursts can take out satellites, disrupt electrical grids and shut down radio communications. There is nothing we can do to avoid solar storms; however, early detection would make it possible to minimize the effects. And, that's what researchers at Uppsala University in Sweden are trying to do.

Figure 1. We are just beginning this solar cycle, which makes early detection particularly important. (Graphic Credit: National Oceanic and Atmospheric Administration, www.noaa.org)
The problem is the amount of data being collected by the digital radio receivers—to be precise, about 6GB of raw data per second. There is no way to store all the data to analyze later, so Uppsala teamed up with IBM and its InfoSphere Streams software to analyze the data in real time.
LJ Associate Editor Mitch Frazier and I had an opportunity to speak with both IBM and Uppsala, and we asked them for more information on how such a feat is accomplished. We weren't surprised to hear, “using Linux”. Here's our Q&A session, with some of my commentary sprinkled in.
Shawn & Mitch: What hardware does it run on?
IBM & Uppsala: InfoSphere Streams is designed to work on a variety of platforms, including IBM hardware. It runs clusters of up to 125 multicore x86 servers with Red Hat Enterprise Linux (RHEL). The ongoing IBM research project, called System S, is the basis for InfoSphere Streams and has run on many platforms, including Blue Gene supercomputers and System P.
S&M: Will it run on commodity hardware?
I&U: Yes, x86 blades.
S&M: What operating system(s) does it run on?
I&U: InfoSphere Streams runs on RHEL 4.4 for 32-bit x86 hardware and RHEL 5.2 for 64-bit x86 hardware.
S&M: Are these operating systems standard versions or custom?
I&U: They are standard operating systems.
S&M: What language(s) is it written in?
I&U: InfoSphere Streams is written in C and C++.
S&M: How does a programmer interact with it? Via a normal programming language or some custom language?
I&U: Applications for InfoSphere Streams are written in a language called SPADE (Stream Processing Application Declarative Engine). Developed by IBM Research, SPADE is a programming language and a compilation infrastructure, specifically built for streaming systems. It is designed to facilitate the programming of large streaming applications, as well as their efficient and effective mapping to a wide variety of target architectures, including clusters, multicore architectures and special processors, such as the Cell processor. The SPADE programming language allows stream processing applications to be written with the finest granularity of operators that is meaningful to the application, and the SPADE compiler appropriately fuses operators and generates a stream processing graph to be run on the Streams Runtime.
[See Listing 1 for a sample of SPADE. Listing 1 is an excerpt from the “IBM Research Report—SPADE Language Specification” by Martin Hirzel, Henrique Andrade, Bugra Gedik, Vibhore Kumar, Giuliano Losa, Robert Soulé and Kun-Lung Wu, at the IBM Research Division, Thomas J. Watson Research Center.]
S&M: Is there a nontechnical user interface to it, or is all interfacing done by a programmer?
I&U: Currently, InfoSphere Streams does not have a nontechnical user interface for developers.
There is an IBM Research project that is working on providing a nontechnical user interface to allow business analysts to have programs generated and run based on information they are looking for. The project is called Mashup Automation with Run-time Invocation and Orchestration (MARIO, domino.research.ibm.com/comm/research_projects.nsf/pages/semanticweb.Semantic%20Web%20Projects.html).
MARIO allows business users to automate composition by letting them specify information goals, which are expressed as high-level semantic descriptions of desired flow output. MARIO uses existing information definitions and available information sources to generate possible applications that generate desired information goals. The optimal application is selected, deployed to the runtime and then the requested information results are displayed to the user.
S&M: Is the data captured and analyzed or just analyzed?
I&U: The benefits of stream computing overcome the problems associated with traditional analytics, which is slow, inflexible (in terms of the kinds of data it can analyze) and not well suited for capturing insights from time-sensitive events, such as tracking an epidemic or financial trading. With InfoSphere Streams, data can be captured and analyzed or just analyzed. Information can be analyzed and the data stored in files or in databases, or sent to other systems for storage. Summarized data and models also can be saved and stored. For example, an application analyzing hydrophone data to study marine mammal populations doesn't capture and store the endless hours of audio, only a model of the results. The model includes number, frequency and duration of visits by the marine mammals.
S&M: Is it open source?
I&U: No, InfoSphere Streams is not open-source code.
[Shawn notes: I'll admit, this was almost a deal-breaker for me. I was dragging out my soapbox as I contacted my IBM representative. It turns out, although InfoSphere Streams isn't open source, IBM does in fact contribute greatly to the Open Source community. I was gently reminded that IBM is a major kernel contributor, invests about $100 million annually in open-source development and “gives back” to the community it benefits from so greatly. I still would prefer InfoSphere Streams to be an open-source project; however, I suppose as long as IBM honors the GPL and is a good member of the Open Source community, I'll put my soapbox away.]
S&M: What value does InfoSphere Streams bring to an organization (in other words, why would someone buy this)?
I&U: As the world becomes increasingly interconnected and instrumented, the amount of data is skyrocketing—and it's not just structured data found in databases, but unstructured, incompatible data captured from electronic sensors, Web pages, e-mail, audio and video. InfoSphere Streams enables massive amounts of data to be analyzed in real time, delivering extremely fast, accurate insights. These insights enable smarter business decision making and, ultimately, can help businesses differentiate themselves and gain competitive advantage.
[Shawn notes: Okay, I get it. I'm convinced InfoSphere Streams is more than a handful of Perl scripts. At this point, we were curious to hear more about the space project itself.]
S&M: What is the project name?
I&U: Swedish Institute of Space Physics REAL TIME High Frequency RADIO WEATHER STATISTICS AND FORECASTING. To put this project in context, it is part of the Scandinavian LOIS Project (www.lois-space.net), which in turn is an offspring of the major European Project, LOFAR (www.lofar.org).
S&M: What are the project's goals?
I&U: Using InfoSphere Streams, Uppsala University is analyzing massive volumes of real-time data to better understand space weather.
Scientists use high-frequency radio transmissions to study space weather or the effect of plasma in the ionosphere that can affect energy transmission over power lines, communications via radio and TV signals, airline and space travel, and satellites. However, the recent advent of new sensor technology and antennae arrays means that the amount of information collected by scientists surpassed the ability to analyze it intelligently.
The ultimate goal of the InfoSphere Streams Project is to model and predict the behavior of the uppermost part of our atmosphere and its reaction to events in surrounding space and on the Sun. This work could have lasting impact for future science experiments in space and on Earth. With a unique ability to predict how plasma clouds travel in space, new efforts can be made to minimize damage caused by energy bursts or make changes to sensitive satellites, power grids or communications systems.
S&M: Is it currently up and running?
I&U: A new generation of high-speed software defined triaxial digital radio sensors has been manufactured and is being tested to be deployed as part of this project. The InfoSphere Streams software is currently being updated for this new hardware and is expected to be deployed with the new sensors in September/October 2009. Prior to the purchase of the new sensors, the project was up and running.
S&M: What type of data is being analyzed?
I&U: Massive amounts of structured and unstructured data from network sensors and antennas are being analyzed as part of this project. By using IBM InfoSphere Streams to analyze data from sensors that track high-frequency radio waves, endless amounts of data can be captured and analyzed on the fly. Over the next year, this project is expected to perform analytics on at least 6GB per second or 21.6TB per hour. The technology addresses this problem by analyzing and filtering the data the moment it streams in, helping researchers identify the critical fraction of a percent that is meaningful, while the rest is filtered out as noise. Using a visualization package, scientists can perform queries on the data stream to look closely at interesting events, allowing them not only to forecast, but also to “nowcast” events just a few hours away. This will help predict, for example, if a magnetic storm on the Sun will reach the Earth in 18–24 hours.
S&M: What type of hardware is being used to capture the data?
I&U: The project uses tri-axial electric dipole antennas (commonly known as tripole antennas) and triaxial magnetic-loop antennas (Figure 2).
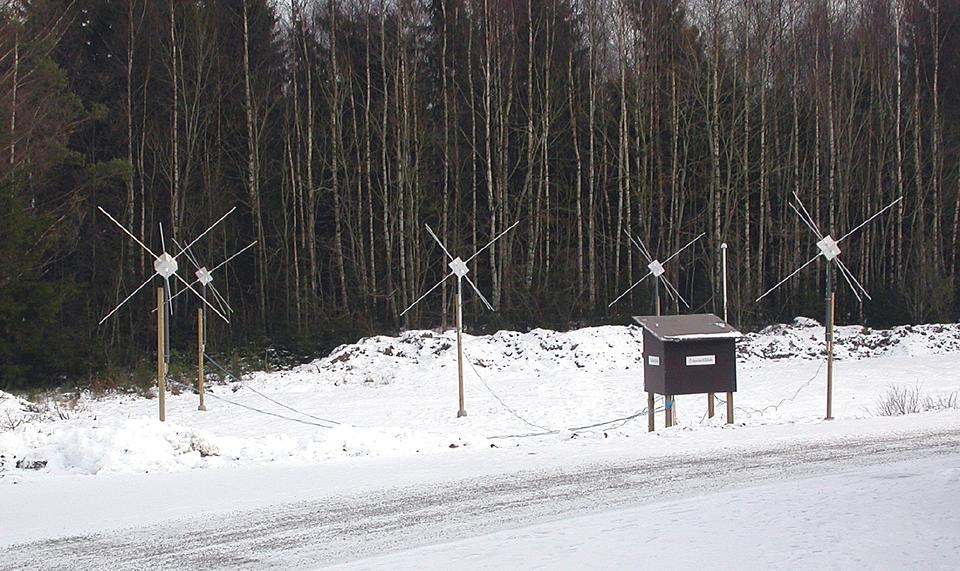
Figure 2. One of the test stations that gathers data for the Uppsala University Project. This station is located in Växjö, Sweden. It includes tripole antennas and three-channel digital sensors along with a GPS antenna and receiver.
S&M: What type of hardware is used in the system?
I&U: In addition to the equipment used to gather weather data, networking equipment to route the data to the Streams runtime, the InfoSphere Streams software has been developed on a 4-core x86 (Xeon) system, but can also be ported to IBM JS20 Blade Center (Power PC) and to a Lenovo ThinkPad X200s laptop.
S&M: What software, beyond InfoSphere Streams, is used?
I&U: RHEL and custom analytics written in C and C++ with some legacy FORTRAN code.
S&M: What is the user interface to the system?
I&U: InfoSphere Streams has a browser-based management console to manage the runtime. It allows people to deploy jobs, see how jobs are distributed across machines in the runtime cluster, see performance details and many other functions to manage the runtime environment. Output from the system can be streamed to various display and dashboarding applications to visualize the results of the real-time analytic processing (Figures 3 and 4).
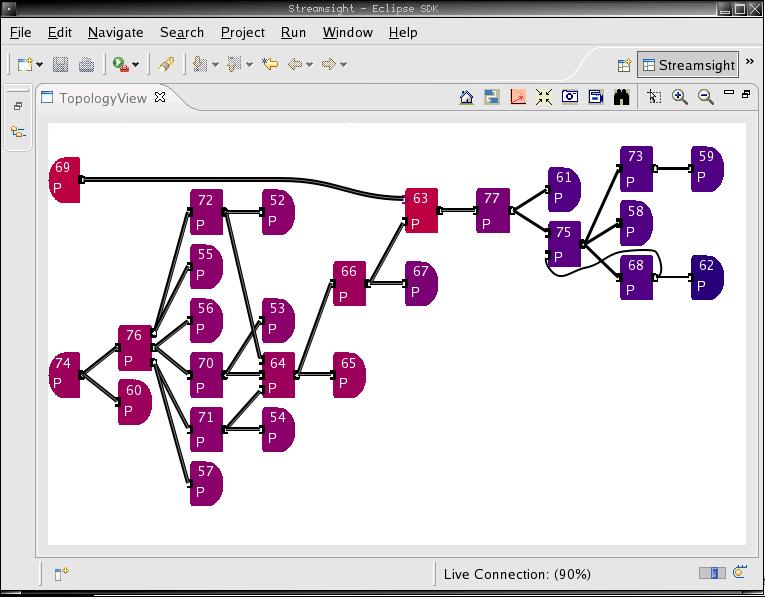
Figure 3. Streamsight is the administrative view of the running InfoSphere Stream. It allows people to visualize on which machines in the Linux cluster the various tasks are running, performance levels and other information. Each box represents a different type of analytic being run, and the lines represent data streaming between each task.
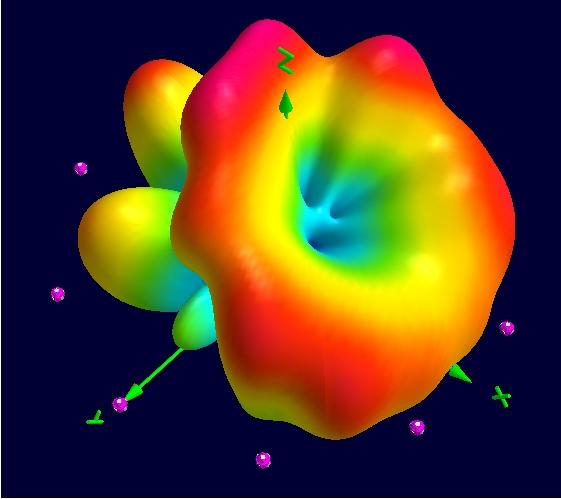
Figure 4. Visualizations of novel 3D radio patterns uncovered in simulation work at the Swedish Institute of Space Physics in Uppsala.
S&M: How long did it take to develop the system?
I&U: The Space Weather application was developed over several months by a PhD candidate at Uppsala University. The larger LOIS Project has been ongoing for eight years.
S&M: How many developers/researchers were involved?
I&U: The PhD student was supported by four scientists and one research engineer from the LOIS team and several IBM researchers.
S&M: Is the space weather software open source?
I&U: No
[Shawn notes: Yes, we really did ask twice about how open these products are. We couldn't help ourselves.]
The Uppsala Space Weather Project is a prime example of how Linux is used as the underlying engine that makes the world go. In fact, Linux has become so mainstream in such projects, we specifically had to ask about what infrastructure the project used. Even then, the answer wasn't “Linux”, but rather what version of Linux. Apparently, it was supposed to be obvious that the project would run in a Linux environment—that's the kind of presumptive attitude I like to see in the world!
Whether the information collected and analyzed by Uppsala will make a difference in how we weather Solar Cycle 24 remains to be seen. At the very least, we'll have more data about space weather than ever before in history. As to our little planet/dwarf planet/plutoid Pluto, sadly we'll have to wait until July 14, 2015 for more detailed information. The New Horizons satellite is racing there now to get more information on the little frozen body. It's hard to say how Pluto will be classified by the time it gets there, but nonetheless, we will be anxiously awaiting the data. When it finally arrives, it's pretty likely the data will be analyzed by Linux.
