
This article walks through the steps to create a Hadoop Linux cluster in the cloud and outlines how to analyze device log data via an example in the R programing language.
This article describes why device log data analysis is useful and briefly introduces the involved technologies and how they fit together. Linux is the basis for the “Infrastructure as a Service” standard that makes the proposed solution portable between cloud providers. Furthermore, we describe the steps you need to go through to create a Hadoop cluster based on Linux in an Amazon cloud. The steps involve bash/install scripts placed in a GitHub repository that allows the automatic installation of all the necessary components and configuration.
Big Data technology and the Internet of Things (IoT) are a strong combination. The IoT is a great source of information and Big Data technology allows for analysis of vast amounts of data. Possible applications are prediction, anomaly detection and device improvement/development. The latter is the case we have been working on in order to investigate why devices break. We need Big Data technology, because classical single-server approaches were unable to process the large amounts of data fast enough for an efficient analysis work cycle.
In this article, we use an example of data analysis of device log data to illustrate how to use a demonstrator setup to find unknown correlations between parameters in log data. However, in this article, we will not go into the device details, but use an abstracted device model approach.
The demonstrator setup consists of selected technologies (Figure 1), developed scripts and installation instructions. This allows for the reproduction of the setup.
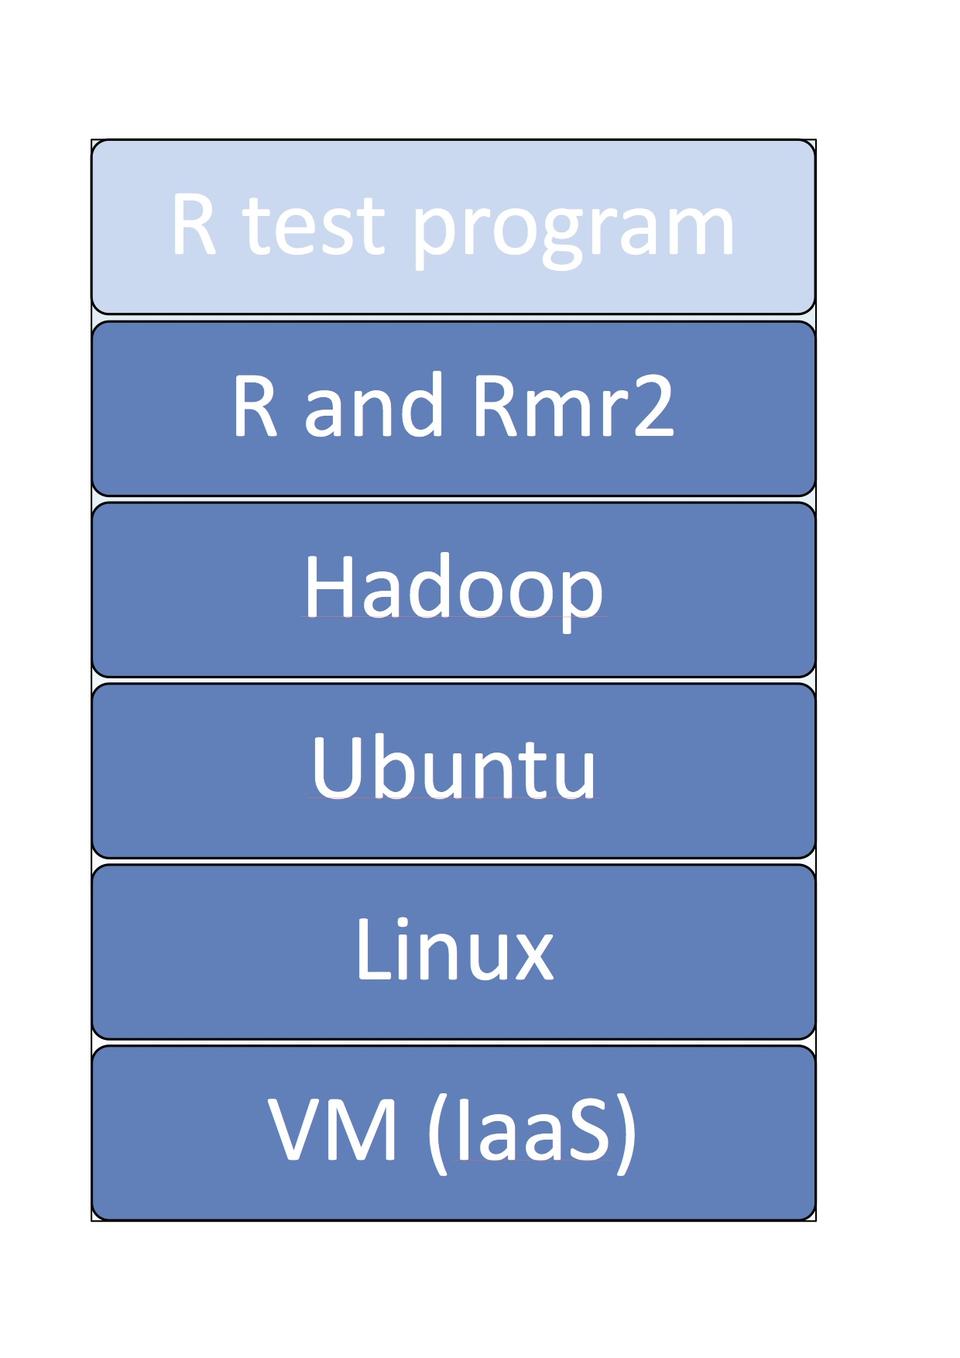
Figure 1. Selected Technologies Layer Model
The so-called cloud is a dynamic market for computer resources. Prices are decreasing over time, but it is far from free, and a credit card is required to get a cloud account. The cloud is important in Big Data analysis, because we require large computer resources only from case to case, and a standing in-house computer cluster is in many situations too expensive, especially for smaller organizations to begin learning Big Data analysis.
When we want to analyze data, we select a cloud provider and create a cluster, do the analysis, and then afterward, we destroy the cluster. This way, we pay only for the computer resources used during the data analysis.
We have selected Infrastructure as a Service (IaaS) as the cloud technology, because it allows for portability of the demonstrator between different cloud providers.
All the cloud providers that we know of offer virtual Ubuntu Linux machines. Ubuntu is a well known Linux distribution, which is why we developed the demonstrator (installation script) for Ubuntu.
We chose to work on Amazon Web Services (AWS), since it's a well established, stable business with well defined and documented interfaces, and it offers a free tier that is very convenient for development work.
Hadoop is a kind of overlay operating system for a cloud cluster of Linux computers. It handles all the resources in the cluster and allows programs to be executed in a distributed manner. Hadoop is written in Java and is rather memory-consuming (when compared to smaller jobs and testing). Hadoop has been the de facto standard for Big Data processing for the past ten years or so. Hadoop consists of a number of components—see Figure 2.
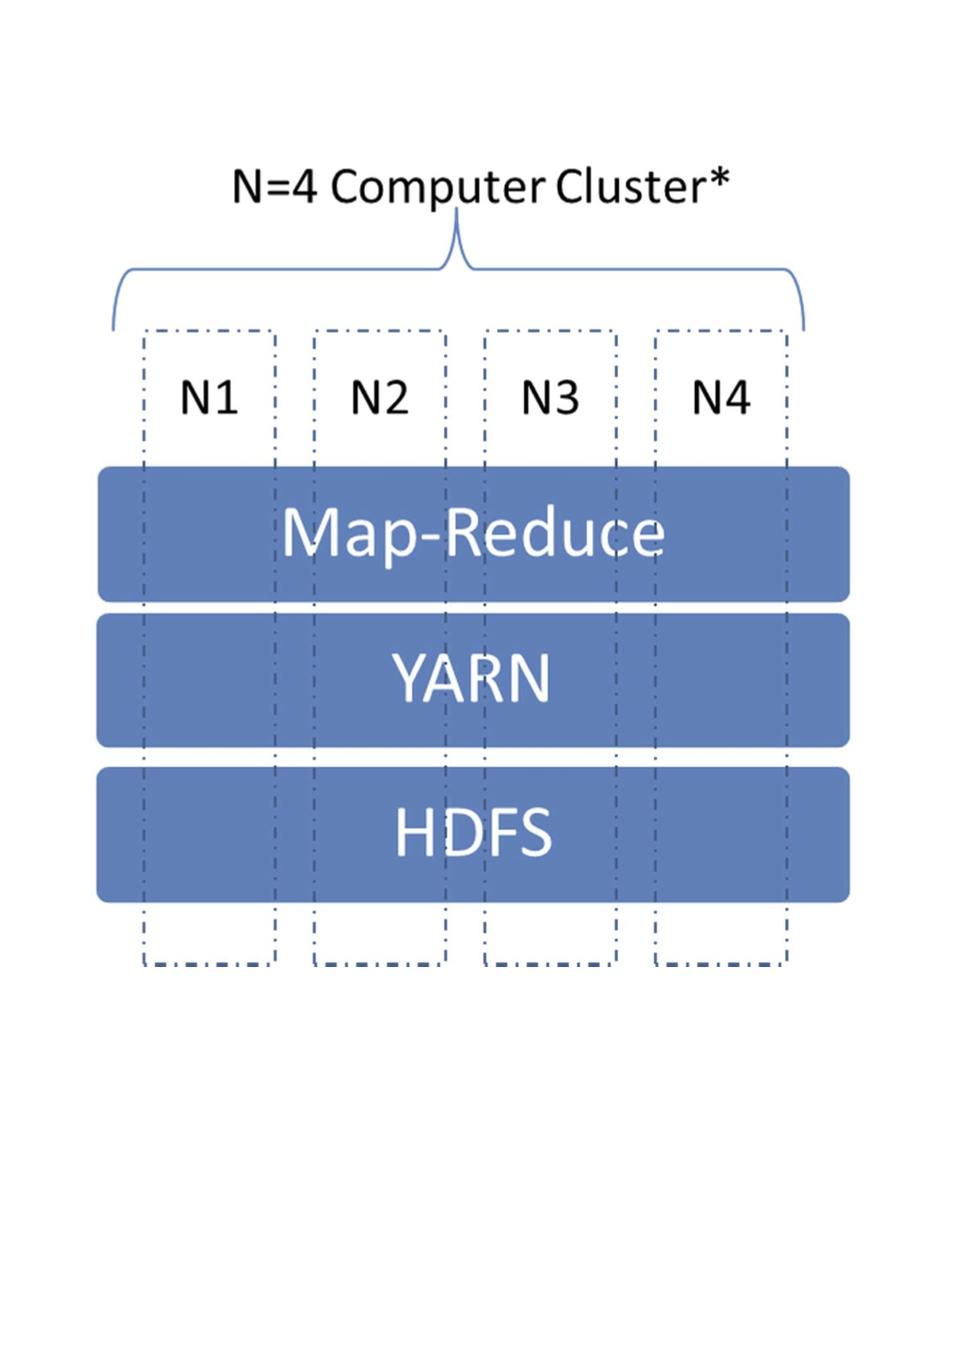
Figure 2. The Main Components of Hadoop
At the bottom is the Hadoop Distributed File System (HDFS) that allows for high data throughput. It handles the I/O bottleneck problem when analyzing vast amounts of data. The data is spread out over the cluster, and the idea is that data is processed where it is stored.
YARN (Yet-Another-Resource-Negotiator) is the central component that allocates resources to Hadoop jobs. Keep in mind that this is no trivial task, because a Hadoop cluster may contain 1000+ nodes. YARN has built-in logic to handle node and job failure in a graceful way. Nodes may disappear and reappear on the cluster network, but jobs must be taken over by other nodes in the meantime.
Map-Reduce is the component that handles the parallelization of analysis tasks. Hard disk and network issues are abstracted away from the developer in order to allow the developer to concentrate on developing the analysis (program). The Hadoop system handles these issues automatically. Be aware that the Map-Reduce framework enforces parallel programming by constraining the programing model, and that can be difficult to get used to. There is a Map function that is responsible for importing data and converting to the internal data format (key-value)—for example, the key is the device ID and the value is a list of temperature data points. There is also a reduce function, one per slave node, that processes data with a certain key. This means, in our case, that all data for one device will be processed by the same slave node.
The Hadoop system will feed the map function with data records. It may be line by line or file by file. The system will distribute the load by dividing the files among the slave nodes for “map” processing. There is no direct filesystem access. The only way to output results is to emit a key-value pair or a list of key-value pairs. There is no shared memory between map instances; each map-node is doing the work on its own—hence allowing for decoupled, parallel processing of data. The developer has no control over which node will process what data. The key-values emitted by map instances are sorted by the system according to the key. Other than this, you cannot assume any ordering of key-value pairs.
In order to speed up execution, the map function may be used to filter out records that are not relevant for the analysis. The Reducer function will receive a list of key-value pairs with a certain key for processing. When done, the function emits key-value pairs. The Hadoop system combines all the key-value pairs from the reducers into the output.
On top of the Hadoop Linux cluster, we have chosen R as the data analysis software. R is a generic math tool that provides a fast interactive process, which is fundamental for data analysis. R is a high-level programing language with many extension packages. This stems from the fact that R is open source and has a large community. Among its packages is data mining. R has a command line that allows an interactive process and fits well with the UNIX environment (scripting).
However, R is classic single computer software; therefore, the R package Rmr2 is needed to allow R programs to run on a Hadoop Linux cluster. Rmr2 is mainly a wrapper of Hadoop into the R environment, and the map-reduce programming model applies to it as shown in Figure 3.
You now can use the entire R language and extensions to write the map/reduce functions. To use Rmr, you must follow these steps: 1) Store input data in HDFS. 2) Write the functions: Map and Reduce. 3) From R, call the map-reduce framework and point to the map and reduce functions. 4) Get output data from HDFS.
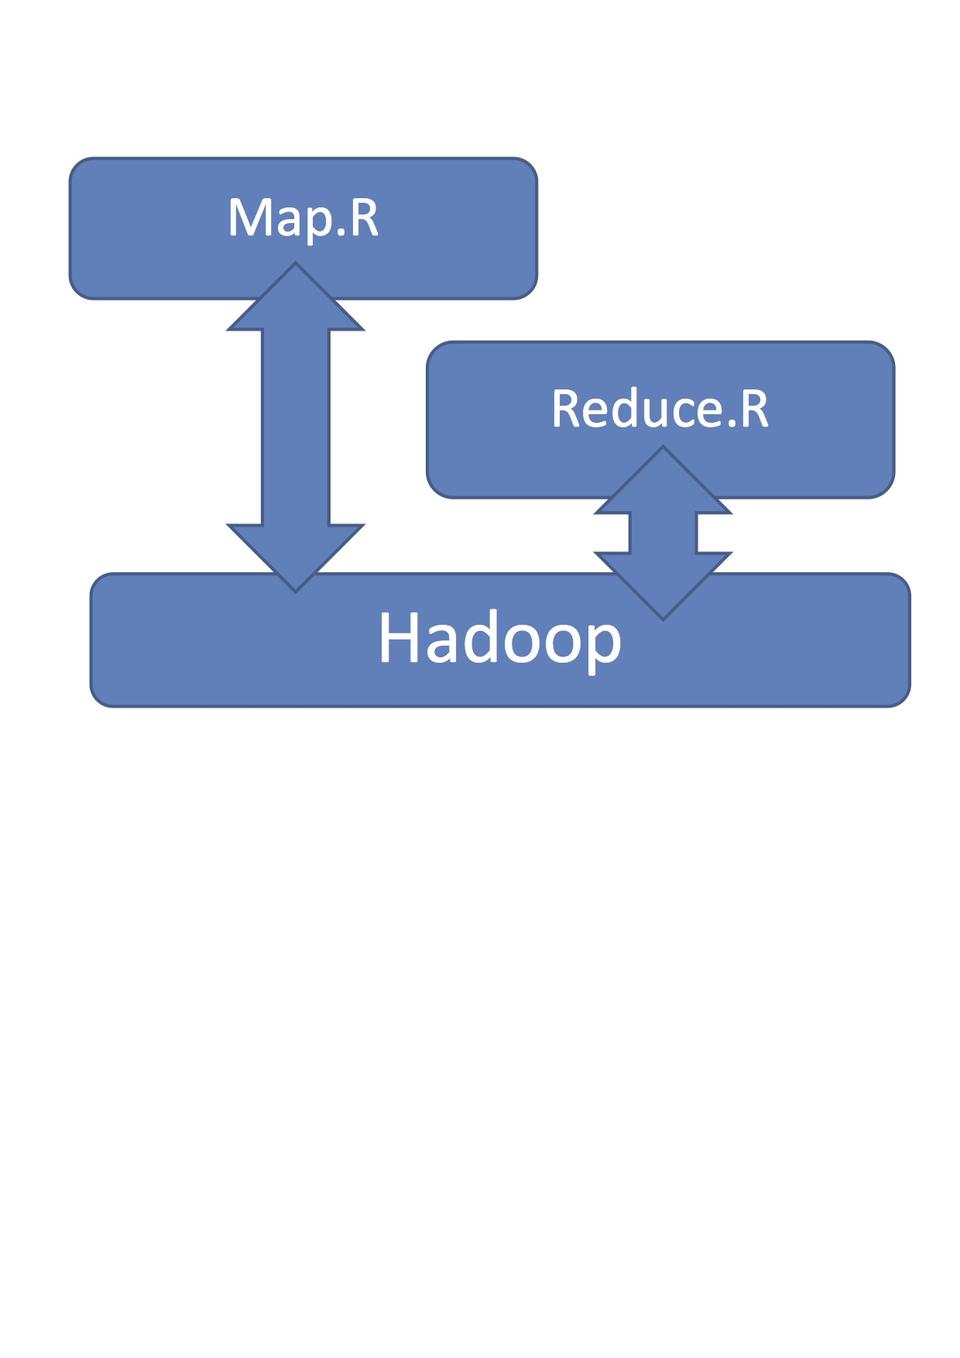
Figure 3. Map-Reduce Functions in R
Before diving into the steps of creating a Hadoop Linux cluster, we want to describe the work flow of the data analysis that we propose (Figure 4).
First, you have to collect and store data in order to have anything to analyze. It has to be stored on a server somewhere on the internet. Next you should determine what and how you want to analyze. In other words, you define your hypothesis and write an analysis program in R. Then create your own R Hadoop cluster. We'll describe the details in the next section. When your R Hadoop Linux cluster is ready, you load your data from the external server into the HDFS and run the analysis program using the R command prompt.
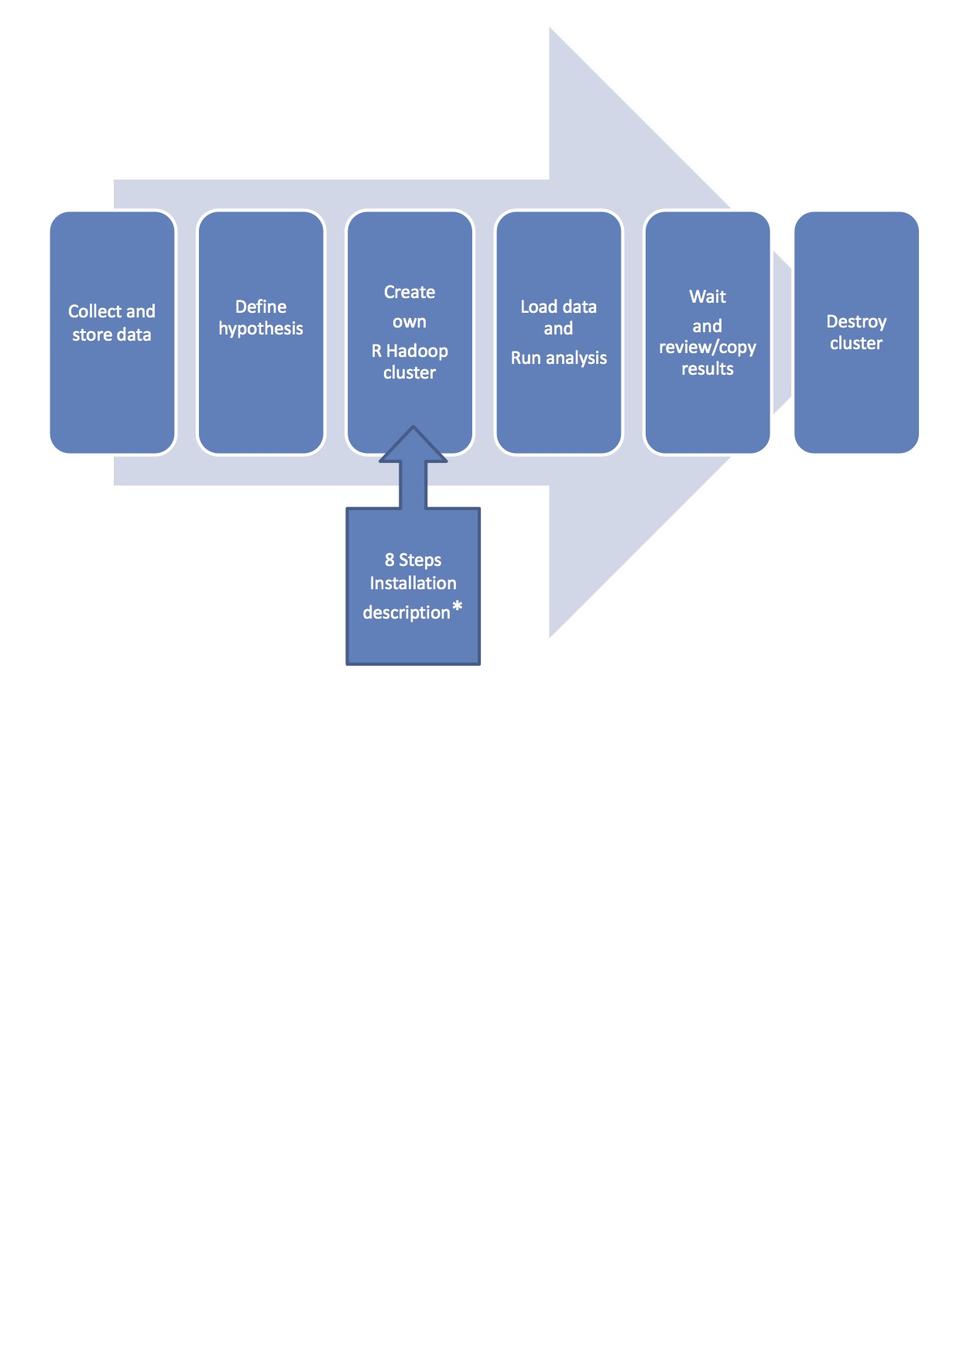
Figure 4. Work Flow with the Demonstrator (*Requires Cloud Account)
When the results are ready, you should review them and copy the result data to a storage server. If the results are not satisfactory, you should change the analysis program and run it again on the cluster. Finally, when done, you should destroy the cluster, since keeping disk and CPU allocation will cost too much if you are not using it. However, it may be sensible to keep the master (template) image, if you want to do more analysis in the future.
In this section, we provide one-line commands that can be copy/pasted into a Linux SSH console. We assume familiarity with AWS virtual machines; there are many tutorials and videos online.
First, install an Ubuntu server that will serve as Master and template for all the slaves:
1) Launch an Ubuntu server 14.04 LTS via Amazon WS web interface (Figure 5).

Figure 5. On the left is a screen dump of the Launch button, and on the right is the Ubuntu Server used.
2) Log in using SSH to your server, and enter the following commands. These will download the installation script and run it:
> wget https://raw.githubusercontent.com/Rustor/EE-DIGI/
↪master/install-big-tools-demo.sh
> bash install-big-tools-demo.sh
The script will install SSH, Hadoop, R and Rmr2 on the Ubuntu server. Hadoop is installed in the “ubuntu” user's home directory, and the Hadoop data files (HDFS) will be placed in /tmp. In addition, it will copy the Hadoop configuration data (basic configuration) from the EEdigi GitHub repo to the Hadoop installation on the server. You can find further code comments in the script. A variation point is, for instance, that you can comment out the R part of the script before running it and install other analysis software, such as Python.
Next, here are the steps to create the template.
1) Shut down the server with:
> sudo init 0
2) Make a snapshot of the master in the AWS web interface (Figure 6).
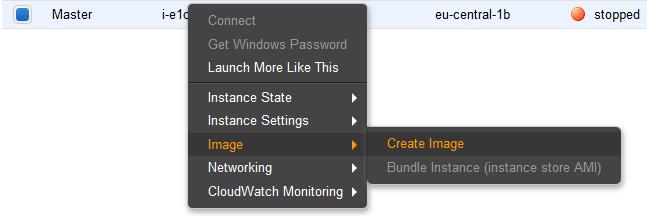
Figure 6. Screen Dump of AWS Create Image Menu
3) Start the master again in the web interface, and log in via SSH.
Then, start forming the cluster based on the master template. All the slaves will know the master's internet address (the hostname is defined as “fe1”) and public key, because you have generated the slaves from the master image. However, the slaves are unknown to the master, and therefore, you now run the following script on the master. The script opens a server that accepts slaves into a list of slaves. The slaves-list is the single point that defines the Hadoop Linux cluster.
4) Run auto-config.sh on the master to accept new slaves:
> bash auto-config.sh
5) Based on the master template, launch two (variation point) instances in the AWS web interface (Launch Step1: My AMIs) and insert these two lines in the AWS interface (user data), as shown in Figure 7:
#!/bin/bash
bash /home/ubuntu/auto-slave.sh
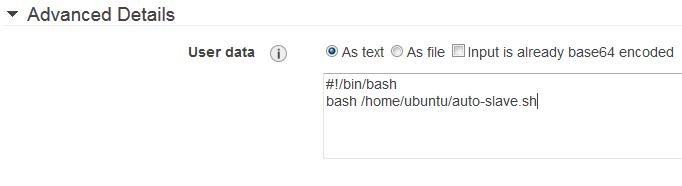
Figure 7. Screen Dump of the AWS Field for User Data
6) Wait some (ten) minutes for all the slaves to come online. If you want, on the master, in another console window, check the online slaves on the master during the process:
> cat cluster-config.file
7) Break auto-config.sh (press Ctrl-C to break) to stop accepting more slaves.
8) Append the cluster.config.file to /etc/hosts, because Hadoop requires DNS names for slaves:
> sudo cp -n /etc/hosts /etc/hosts.org
> sudo -- sh -c -e  "cat cluster-config.file >> /etc/hosts"
9) Update the Hadoop slaves list with the DNS names from the cluster-config.file, but remove the internet address information:
> cat cluster-config.file | cut -f 4 -d " " >
 ↪/home/ubuntu/hadoop/etc/hadoop/slaves
10) Add the slaves to ssh/known.hosts to avoid SSH warnings:
> ssh-keyscan  -H  -f  /home/ubuntu/hadoop/etc/hadoop/slaves  >>
 ↪~/.ssh/known_hosts
11) Copy /etc/hosts to all slaves to allow them to communicate using DNS names:
> wget https://raw.githubusercontent.com/Rustor/EE-DIGI/
↪master/update-all-slaves.sh
> bash update-all-slaves.sh
In this section, you have now, on AWS, created a Linux Hadoop cluster based on a single master installation. This installation has all the necessary software tools and configuration so that you can dive in to using and testing the cluster—see the next section.
We wrote an R program to find correlations between data logs. To develop this program, we needed test data. Therefore, we have generated log files from random data. Each log file contains a number of variable data or signals. The R program (demonstrator) requires a format where each data record has a device ID and is stored on one line with time-date:
Time-date, device_id, var1, var2, var3, var4
However, we have multiplied one of the signals in one of the log files with a sinus curve. Without knowing which log, we have designed the R program to use a correlation function to find it. Correlation (cor) is a mathematical function that given two signals will output a number between 1 and –1. Zero (0) means that the two signals are unrelated or not detectable by the algorithm. A value above 0.75 or below –0.75 is considered a significant correlation.
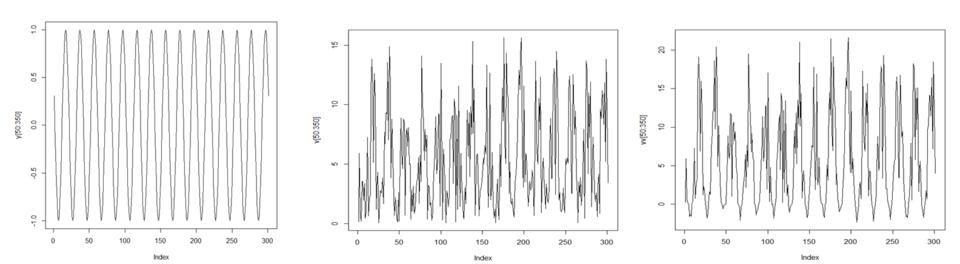
Figure 8. Illustrations of a couple device log files. On the left is the sinus signal. On the right of this are two log file signals: V (middle) and VV (right).
An R program using the cor function was able to find the data log that was multiplied with a sinus curve. It is difficult to tell which one of the signals matches just by inspection. Correlation of the signals in Figure 8 result in the following output:
cor(v,y)
[1] 0.5779192

cor(vv,y)
[1] 0.7557141
As you can see, the signal VV has a correlation of 0.7557141 with y. We have found the log/signal that was multiplied with the sinus curve.
Based upon what we have presented in the previous section, we made a small example (25MB) with ten “spreadsheet files”, each with 4,000 lines and 9 columns of data. We have scaled down the test that we present in this article in order to be able to run in the Amazon free tier on three computers: one master and two slaves. You can scale up the example, if you are willing to pay for machines with more RAM. The R analysis code does not require changes.
Enter the Hadoop directory, format the HDFS and start the whole system (Hadoop dæmons on the different machines). The following will initialize all nodes:
> cd hadoop
> bin/hdfs namenode  -format
> sbin/start-all.sh
Then you have to generate the test data. You should download and run the script found in the EEdigi repo on GitHub:
> wget https://raw.githubusercontent.com/Rustor/EE-DIGI/
↪master/genEEdigi-test-data.R
> Rscript genEEdigi-test-data.R
Next, put the test data into HDFS, and for that, you make a directory structure (as required by the analysis program):
> bin/hadoop  fs  -mkdir   /rhadoop/eedigi/xdata
> bin/hadoop  fs  -put  -f  TESTdata*.csv  /rhadoop/eedigi/xdata
Now the cluster should be running with data loaded. You need to download the EEdigi analysis program and run it after you first have set up the Rmr2 environment in an R session. The important parts of the R code are shown in Listing 1.
Get the EEdigi data analysis program:
> wget https://raw.githubusercontent.com/Rustor/EE-DIGI/
↪master/EEdigitest.R
Run the program in the R command prompt:
> R
> source("etc/hadoop/hset.R")
> source("EEdigitest.R")
> q()
Use the following instructions if you want to close down the cluster:
> sbin/stop-all.sh
1) Shut down all machines in the AWS web interface.
2) Terminate the slaves (keep the master instance and image) in the interface.
After reading this article, you should be able to set up a Hadoop Linux cluster in a short amount of time. We have also provided a way for you to test the cluster using R. The open-source tool chain fits nicely together, and you'll be able to learn about Big Data analysis at no cost.
With the current cloud price structures, our recommendation is to use a cloud cluster when you have a small budget (for computing), and your need for it is transient. If at some point you are using many machines constantly for an entire month, you should consider building a local computer cluster. While doing the project, we learned that buying 50 strong computers as hardware would have cost a similar amount as renting 50 strong computers for one month.
When using a free tier, remember that the cloud will cost you money over time. It is the cloud providers' business to charge for using their computing resources. Cloud providers have extensive price information, and they will charge you for every use of a virtual server—for example, storage of hard disk images and machine templates, data out of the data center (region). Even when you use the free tier, read your bill carefully for unexpected costs due to a tiny mistake on your side—for example, using more storage than included in the free tier. The best you can do is to make a small budget for cloud usage in order to prepare you and your organization's mindset. Then you should run trials based on your typical analysis tasks to determine what type of machines and which provider is most suited.
Do not use the intuitively impressive-sounding Software as a Service (SaaS), but stick to generic virtual machines, as we used in this article. Otherwise, you most likely will be investing in learning a proprietary SaaS interface and will lose the ability to switch cloud providers without high switching costs. Managing Linux machines (servers) for short periods should not be a problem in terms of operational costs. In our experience, in-depth knowledge about Linux and computer hardware (performance) is highly relevant when using cloud computer resources. After all, you are given complete control of a real CPU and RAM, if only for short period.
This work was supported by The Southern Denmark Growth Forum and the regional EU project “IoTstyring”, which is a project about energy efficiency in embedded control systems using Big Data and IoT technologies.
