Wonder who (or what) is hogging your bandwidth? Install a network monitor.
In a previous article, I explained the process for setting up Cacti, which is a great program for graphing just about anything (see the November 2016 issue). One of the main things I graph is my internet usage. And, it's great information to have, until there is internet activity you can't explain. In my case, there was a “blip” every 20 minutes or so that would use about 4mbps of bandwidth (Figure 1). In the grand scheme of things, it wasn't a big deal, because my connection is 60mbps down. Still, it was driving me crazy. I don't like the idea of something on my network doing things on the internet without my knowledge. So, the hunt began.
Most folks immediately told me to use Wireshark to analyze the data. That's good advice, but the problem makes me want a real-time monitoring system rather than a one-off packet search. Plus, even with Wireshark, you need to address the issue of capturing all the data flowing to and from the internet. Modern switching hardware purposefully directs traffic only to the ports on your switch where the traffic is intended. That means you can't just “sniff” the whole network without some effort. So regardless of how I was going to analyze the traffic, I had to be able to see the traffic. Thankfully, there are a few ways to accomplish that.
Network hubs were very common 20 years ago. The idea with a hub is that the network data coming in is repeated to every port on the hub, and whichever computer the packet was intended for accepts it. Every other computer just ignored the data. This worked fine when the amount of data was low and the speed of the data was slow, but as more devices were added to the network, it quickly became congested. About that time, “switching” technology entered the picture. A switch would accept data on every port, but repeat the packets only to the single port on which the intended device was listening. At first, switches were extremely expensive, so it wasn't uncommon to see a four-port rackmount switch that had hubs connected to each port. It was a way to segregate the congestion into manageable chunks. Eventually, switching technology became mainstream. Now even the $10 eight-port devices you can buy online are switches instead of hubs, and the idea of a hub is outdated.
Why is all that important? Well, if you're trying to monitor an entire network, switches work against you. Back in the day of hubs, every computer saw all the traffic on a network, which made it easy to monitor what was happening. (It also made it easy to sniff other people's packets, but that's another story altogether.) Thankfully, there are a few options for capturing all the data so you can analyze traffic on your network.
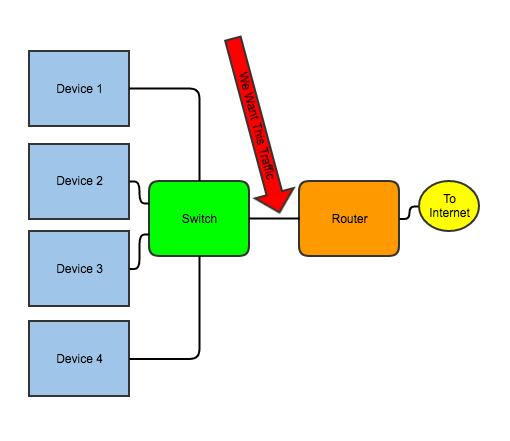
The first thing to determine is where you want to monitor. You can monitor only traffic flowing through a certain place, so you need to determine where that place is. In my case, I want to monitor internet traffic, so from a port standpoint, I want to see all the traffic flowing into and out of where my router plugs in to my LAN (Figure 2). There are a few ways to capture that data—let me run through the options.

Figure 2. This is the bottleneck through which all internet traffic flows.
If you look at Figure 3, you can see how this option works. All the internet traffic flows through the hub into the router. Because hubs repeat all data to every port on the hub, you simply plug the monitoring computer in to that same hub, and it “hears” all the network traffic to and from the internet. There are a few problems with this method. One, it's difficult to find hubs anymore, especially those capable of 100mbps. Even if you can find a hub, it will be a cheap desktop type that is likely not reliable enough to handle all your data. Quite honestly, even though option 1 is technically still feasible, it's a really bad idea, and I don't recommend it.
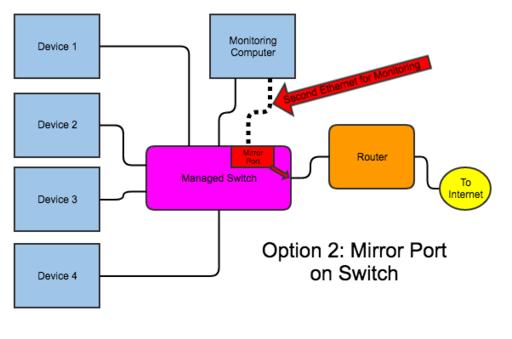
This is probably the best way to monitor network traffic in a modern LAN environment. Figure 4 shows what it looks like. The only problem with this method is that it requires a “smart” or “managed” switch. That usually increases the cost drastically, but it gives you other management features like VLANs. Still, if you already have an unmanaged switch, this can be a large expenditure. If you want to use this method in an environment already populated with unmanaged switches, perhaps consider getting a small managed switch and put it in place of the hub shown in Figure 3.

Figure 4. This is probably the best way to monitor traffic, but it requires a managed switch, which I didn't have.
The actual process for mirroring a port works differently on different brands of switches. Regardless of the specific method, however, all managed switches should allow you to mirror the traffic from one port to another. Then your monitoring computer can listen on that mirror port and analyze the traffic. It's sort of like creating an internal two-port hub that sends traffic only one way. Usually if you do this, it's wise to “sniff” with a second Ethernet card on the monitoring computer. That way, you're not confusing traffic to and from the monitoring computer with the internet traffic.
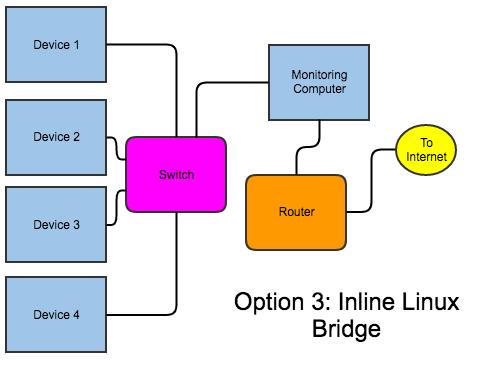
Figure 5 shows what I actually did on my network. I didn't use this method because it's better than option 2; rather, I used it because I didn't have a managed switch. Basically, in this setup, you need a monitoring server with two Ethernet cards. You create a “bridge” interface, and plug the computer in between the switch and the router. This does capture all the traffic because it literally flows through the computer. Unfortunately, it means if something goes wrong with your monitoring computer, it can take down internet access for your entire network, along with DHCP and DNS if your router hosts those for you. There are special Ethernet cards with multiple ports that “fail open”, so that if the machine does, traffic still flows. If you're going to spend money on this, however, I recommend just getting a managed switch and doing a mirrored port.

Figure 5. Although possibly not the best way to do it, this is probably the nerdiest. It's also the way I did it, because it didn't require any new hardware.
This option works only if your router is robust enough to run bandwidth-monitoring tools. Some are, especially if you're using a full-blown server as a router. Most can do it, but not well. Still, if you only want simple monitoring and your router can handle the load, it's an easy way to do it.
I went with Option 3, which meant I needed to install a network bridge on my Linux machine. On Ubuntu, the process is really simple. It's not difficult on other distros like CentOS, but if you're using something other than Ubuntu, you'll need to google the specific steps. For Ubuntu, do:
apt-get install bridge-utils
Then edit your /etc/network/interfaces file:
# The loopback network interface
auto lo
iface lo inet loopback

# The bridge interface
auto br0
iface br0 inet dhcp
    bridge_ports eth0 eth1
    bridge_stp off
    bridge_fd 0
    bridge_maxwait 0
You'll need to adjust your interface names if your Ethernet devices don't come up as eth0 and eth1, but the configuration should make sense from looking at my example. You either can restart networking or, even better, reboot your system to make sure it comes up properly on startup. Once up and running, the ifconfig command should look something like mine:
spowers@pooky:~$ ifconfig
br0    Link encap:Ethernet  HWaddr 00:25:90:34:d4:3a
       inet addr:192.168.1.6  Bcast:192.168.1.255  Mask:255.255.255.0
       inet6 addr: fe80::225:90ff:fe34:d43a/64 Scope:Link
       UP BROADCAST RUNNING MULTICAST  MTU:1500  Metric:1
       RX packets:1820381471 errors:0 dropped:0 overruns:0 frame:0
       TX packets:124514207 errors:0 dropped:0 overruns:0 carrier:0
       collisions:0 txqueuelen:1000
       RX bytes:1850742830285 (1.8 TB)  TX bytes:34896441989 (34.8 GB)

eth0  Link encap:Ethernet  HWaddr 00:25:90:34:d4:3a
       inet6 addr: fe80::225:90ff:fe34:d43a/64 Scope:Link
       UP BROADCAST RUNNING MULTICAST  MTU:1500  Metric:1
       RX packets:1040590501 errors:0 dropped:56421 overruns:0 frame:0
       TX packets:782968757 errors:0 dropped:0 overruns:0 carrier:0
       collisions:0 txqueuelen:1000
       RX bytes:1101548247906 (1.1 TB)  TX bytes:493789819966 (493.7 GB)
       Interrupt:16 Memory:fb5e0000-fb600000

eth1  Link encap:Ethernet  HWaddr 00:25:90:34:d4:3b
       UP BROADCAST RUNNING MULTICAST  MTU:1500  Metric:1
       RX packets:1001689311 errors:0 dropped:55961 overruns:0 frame:0
       TX packets:1165557388 errors:0 dropped:0 overruns:0 carrier:0
       collisions:0 txqueuelen:1000
       RX bytes:797026007540 (797.0 GB)  TX bytes:1134936725326 (1.1 TB)
       Interrupt:17 Memory:fb6e0000-fb700000
Note the only interface with an IP address is br0. The other two interfaces are bridged together, so traffic can freely flow through them. It's interesting that this is the way distributions like Untangled work. They create a bridge device and then filter/block/redirect traffic as it passes through.
So far, I've gotten only to the point where the monitoring computer can listen to the traffic going to and from the internet. I haven't actually installed any software to do the listening. Quite a few different packages exist for capturing traffic and analyzing it. Depending on the type of network trends you're looking for, you might choose a different software package from me. I actually installed a few, but rely most on BandwidthD for analyzing traffic. I'll talk more about BandwidthD, but be sure to check out some others too:
Darkstat: https://unix4lyfe.org/darkstat
Etherape: etherape.sourceforge.net
Ntop: www.ntop.org
Wireshark: https://www.wireshark.org
BandwidthD: bandwidthd.sourceforge.net
I like BandwidthD because it shows traffic graphs for each device on my network. If you remember my initial problem, I was trying to figure out what device on my network was downloading something every 20 minutes. I figured it was a game system or cell phone stuck in a failed download loop or something.
Installing BandwidthD (or most any of the utilities) is a simple apt-get install away. The software is most likely in your distribution's software repository, and even if the version is a little outdated, it should work perfectly fine. The only thing I needed to do is edit /etc/bandwidthd/bandwidthd.conf and set the network I wanted to monitor and the interface I wanted to listen on. Otherwise, I left everything the default. BandwidthD installs an Apache configuration file, so you should be able to access its interface at http://server.ip.address/bandwidthd/.
After it's running for a while, you should see statistics like those in Figure 6, which shows the top 20 bandwidth users on my network. It's fun information to see, but if you're looking for a specific traffic pattern, you'll need to scroll down a bit to see network graphs for every device on your network. Figure 7 shows the traffic to and from my Plex Media Server. Keep in mind this is only traffic going to and from the internet, but still, you can see when friends and family were watching videos from my server over the internet. It's important to note that although the default page of BandwidthD shows only the top 20 users, you can click on the network address to see every user who accesses the internet. It's an amazing tool for figuring out what's happening on your network.
It turns out that I couldn't find anything on my network causing those network usage spikes every 20 minutes. I looked at the graphs for every single device on my network and compared it to the spikes on my Cacti bandwidth graphs. I just couldn't find a match. Then I realized that my total bandwidth graph from BandwidthD should come pretty close to matching my WAN bandwidth graph from Cacti. And, it didn't. My entire network monitoring server setup seemed to be for nothing, because I couldn't track down what was causing the blips.
I decided to troubleshoot my Cacti installation to see if there was something happening every 20 minutes to cause an error. It was then that I noticed that while the WAN interface on my router had the blip every 20 minutes, the LAN side of my router (which I graph, but never really look at because it's just an inverse of the WAN graph) didn't have the blip. It turns out that my UniFi router has a feature that runs a speed test every 20 minutes to graph the health of the connection. I don't remember turning that feature on, but sure enough, it was enabled. When I disabled the periodic speedtest, my network blips stopped.
So in the end, my network monitoring setup didn't find anything, but I don't regret setting it up. Now I can monitor traffic easily and see what sort of bandwidth requirements individual devices need. In fact, the only change I plan to make is to set up my server using Option 2 instead of Option 3, because I recently upgraded my server rack to managed switching hardware. That way if my monitoring computer dies, my internet connection stays up.