
When working with AWS, it's common to have a number of separate accounts run by different teams for different projects. Gaining an understanding of how those accounts are configured is best accomplished by visually displaying the resources of the account and how those resources can communicate. This complements a traditional asset inventory.
Duo built CloudMapper to generate interactive network diagrams of AWS accounts and released it as open source on Github.
See a demo here.
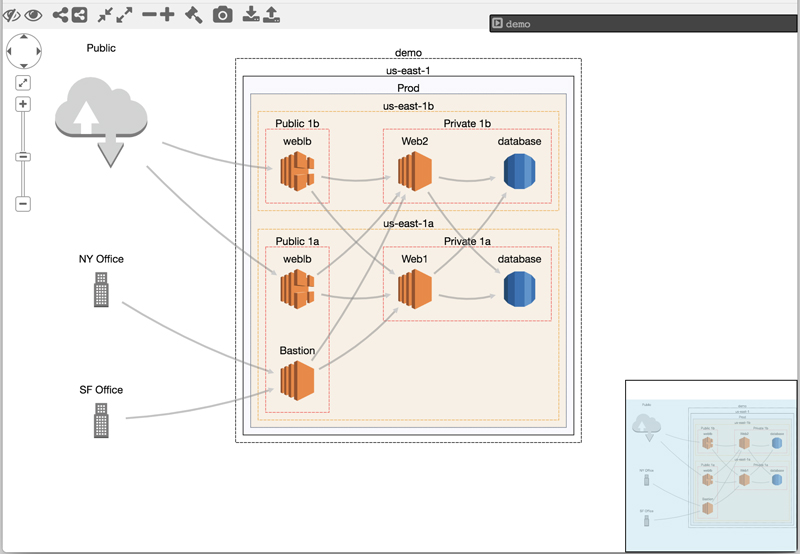
Figure 1. Screenshot of CloudMapper Visualizing a Demo Account
Using CloudMapper, you can quickly answer a number of questions, such as:
CloudMapper allows engineers to double-check their understanding of what they've built, quickly understand other environments and present that information to other stakeholders.
There are three steps to getting up and running with CloudMapper:
The first step of collecting information only requires the privileges to
describe and list information about an account. This can be done with the
AWS SecurityAudit policy. If you don't have direct access to the
account, someone who does can run this script and send you the bundle of
files it creates.
The second step of converting these cached files into something for the web browser display is where most of the logic is. This is where the Security Groups are analyzed to determine what network pathways exist, and parent/child relationships are created between nodes, such as EC2 instances, and compound node structures, such as subnets, availability zones, VPCs, regions and accounts.
The final step of visualizing the data in the browser makes heavy use of cytoscape.js to perform the graph layout and allow interaction with the resources. Historically, this problem would have been solved with graphviz, but that solution is more suited toward generating static images as output. Cytoscape originally was created to visualize molecular interaction networks, but it has been found to be well suited for a variety of other network visualizations.
By using cytoscape.js and presenting the diagram to the user in a web browser, you can click on nodes to get more information about them, move them around, delete them and more. This is only for visualizing the data, so any actions you take will not impact your actual AWS environments.
You can zoom in and out, pan, save a high-definition image, or save and load the layout after you've moved nodes around. You can click on a compound node, such as a VPC, and compress it to a single node in order to simplify the visualization. You easily can find and select neighbors, siblings, children or parent nodes. You can click on edges to get details about the Security Groups that are allowing that communication to happen.
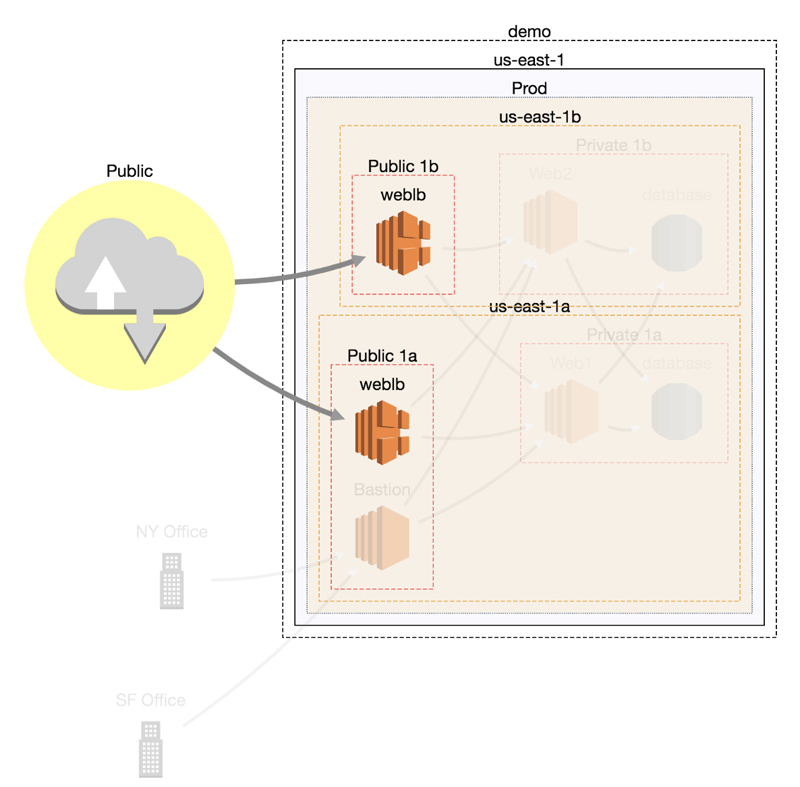
Figure 2. Highlighted Neighbors
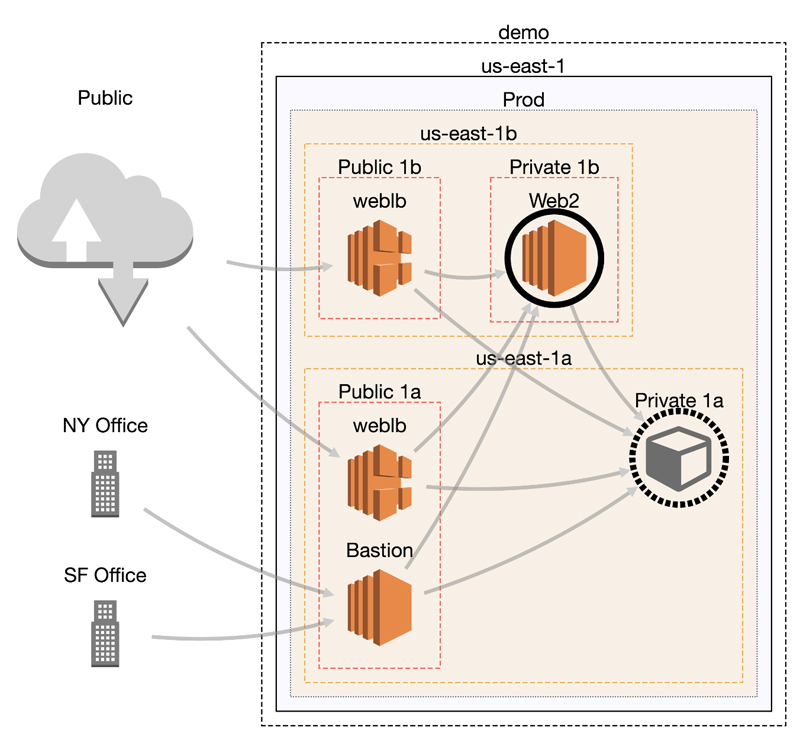
Figure 3. Compressed Node
Visualizing large networks is a hard problem. CloudMapper uses the CoSE (Compound Spring Embedder) layout for Cytoscape.js that was developed by the i-Vis Lab in Bilkent University, which is regarded as one of the best algorithms for laying out graphs with compound nodes. However, any graph with a large number of nodes and edges is inherently complicated. To manage this problem, CloudMapper has a number of filtering options that can be used when preparing the data for visualization.
Options to reduce the amount of data displayed include:
Even with these techniques and the advanced layout algorithm used, still be prepared to spend some time rearranging the nodes.
—Scott Piper, AWS Security Consultant
