
I've been covering chemistry software in my last few articles, so this time, I decided to move to physics and introduce a package called JaxoDraw. In physics, there's a powerful technique for visualizing particle interactions at the quantum level. This technique uses something called Feynman diagrams, invented by physicist Richard Feynman. These diagrams help visualize what happens when one or more particles have some kind of interaction. I say one or more because a single particle could spontaneously kick out other particle/anti-particle pairs and then swallow them back up again. Needless to say, quantum physics is weird.
When first developed, theoretical physics was mostly done either with pen and paper or on a chalkboard. Not much thought was given as to how you could render these drawings within a document being written on a computer. JaxoDraw is meant to help fill in that gap in document layout and provide the ability to render these drawings correctly and give output you can use in your own documents.
JaxoDraw is written in Java, so it should run under almost any operating system. Unfortunately, it isn't likely to be in the package repository for most distributions, so you'll need to download it from the project's website. But, because it's packaged as a jar file, it's relatively easy to run.
Download the binary package, unpack it on your machine, and then you'll want to open a terminal and change directory to the location where you unpacked JaxoDraw. You can start it simply by typing the following:
java -jar jaxodraw-2.1.0.jar
This opens a blank workspace where you can start your diagram. On the left-hand side of the window, you'll see a palette of all of the available drawing elements that you can use to generate your diagram.
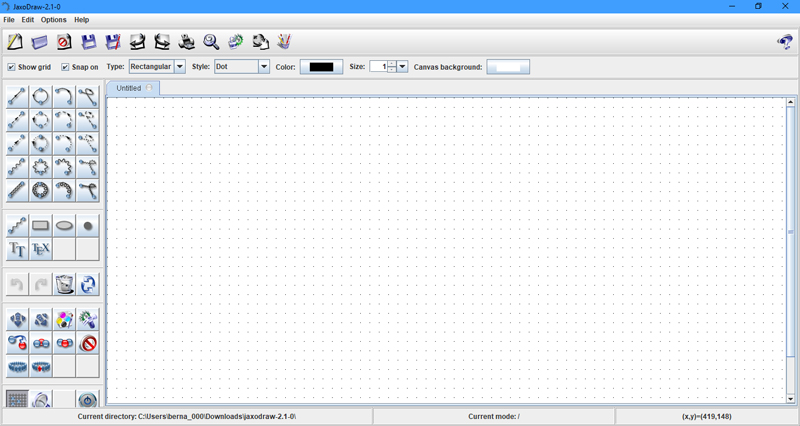
Figure 1. When you first open JaxoDraw, you see a blank workspace where you can start diagramming your quantum particle interaction.
To see what's involved, let's draw an electron interacting with a photon. This happens when energy is absorbed or emitted by an electron. Since you're looking at an interaction, you'll want to start by selecting the vertex button from the palette and then draw one in the window. Coming into this vertex will be a fermion line for the electron and a photon line for the incoming electromagnetic energy. The interaction happens at the vertex, with a second fermion line coming out the other end. You can continue adding more elements, including loops or bezier lines, and you also have the choice of other particle types, such as scalar particles, ghost particles or gluons.
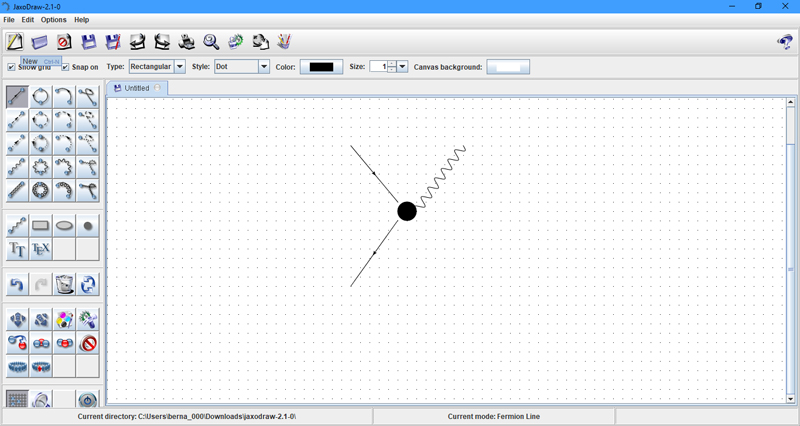
Figure 2. A basic interaction is an electron absorbing a photon's worth of energy and continuing on.
If you click the edit button in the function palette on the left-hand side and then select one of the elements of your diagram, you'll get a pop-up window where you can edit parameters including the position, size and location of any extra parts, like arrow heads or the color used for a given element. This edit window varies based on what parameters can be changed for a given element.
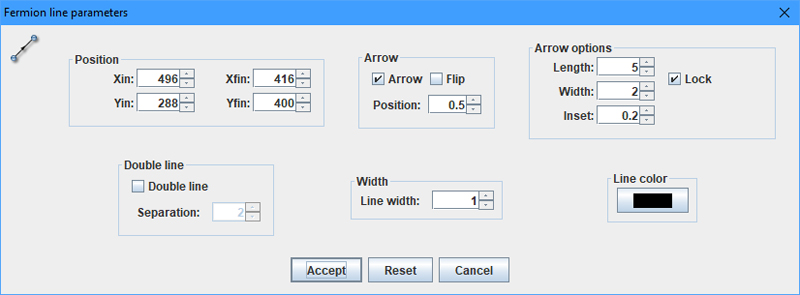
Figure 3. You can edit several parameters of the elements within your diagram.
JaxoDraw also includes a plugin architecture, where you can extend its functionality. A list of current plugins is available at the plugin website, which currently consists of other exporters to generate other file types of your diagrams. There is also a set of instructions on how you can create your own plugins.
Once you download the plugin file, click the menu item Options→Plugin Manager to pop up a dialog window where you can install the plugin within your installation of JaxoDraw.
By default, JaxoDraw saves diagrams as XML files. Since it is a text file that essentially contains a description of the elements of your diagram, you theoretically could manipulate a file with something as basic as a text editor. But, this isn't why you'd want to use JaxoDraw. If you click File→Export, a dialog window pops up where you can choose the details of how to export your diagram.
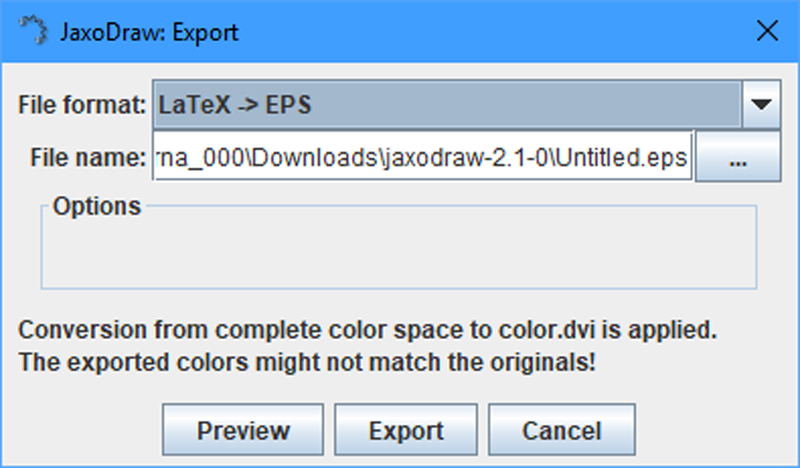
You can export your Feynman diagram in several different formats.
Since JaxoDraw is aimed at physicists, you'll most likely want to export your diagram into a form you easily can use with LaTeX, the most often used document layout system when theoretical physicists write for scientific journals. If this is the case, you actually have two options. You can save it as a pure LaTeX file that you can include in your document, or you can export as an encapsulated PostScript (EPS) file, which also can be manipulated within your document. If you're using something else to generate your document, you can export your diagram in some type of regular image format. Currently JPEG and PNG are supported, so you should be able to generate diagrams regardless of your needs with all of these options.
—Joey Bernard
