tuptime
tool. By Ricardo Fraile
Finding your system's uptime is easy if the "beginning" means the last startup; the
historical uptime command reports that information. But what happens
if by "beginning" you mean the first startup ever of the system? Or the last 365
days? Or the last month?
Is there any way to have an accumulated uptime—or even better, a look at the whole
system's life? For example, cars have odometers, and you can see the
miles/kilometers
since the first day. For computers, a tool
was developed exactly for this task: tuptime.
tuptime reports the historical and statistical running and stopped time
of your system, keeping track between restarts. Its main goals are:
It works very simply. tuptime falls to the init manager for
execution at startup and shutdown, and then into a cron task that launches
regular executions in the meantime—there isn't any dæmon to
worry
about. Internally, it looks at the btime value
(available in /proc/stat)
and the uptime value (from /proc/uptime), and that's basically
it.
The installation process is easy in Debian, Ubuntu and derivative distributions, using their respective package managers, and it should be available in all the official repositories. As prerequisites, it needs Python 3 and the SQLite library, which usually are included in core packages by default.
Once it's available on your system, you can get the information. It has three output formats: the default is a summary, and there also are table and list outputs to print the registered behavior.

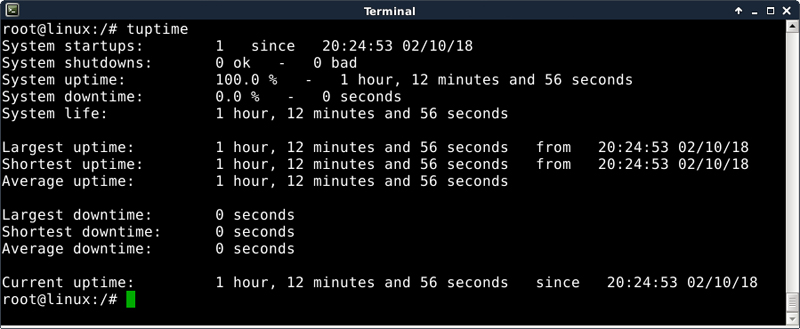
Figure 1. Example tuptime Execution after
Installation
The first execution reports the time since the system was booted, and the lines are self-explanatory (note that the date format is based on the system's locale settings):
$ tuptime
System startups:    1   since   22:21:49 02/02/18
System shutdowns:   0 ok   -   0 bad
System uptime:      100.0 %   -   40 minutes and 22 seconds
System downtime:    0.0 %   -   0 seconds
System life:        40 minutes and 22 seconds


Largest uptime:     40 minutes and 22 seconds   from
 ↪22:21:49 02/02/18
Shortest uptime:    40 minutes and 22 seconds   from
 ↪22:21:49 02/02/18
Average uptime:     40 minutes and 22 seconds


Largest downtime:    0 seconds
Shortest downtime:   0 seconds
Average downtime:    0 seconds


Current uptime:  40 minutes and 22 seconds   since
 ↪22:21:49 02/02/18
When getting this report from an older system (see below), the information becomes more
interesting. Apart from the fact that the counts increase, there also are
more facts
about the behavior. For example, the System shutdowns line has
11 "bads", reflecting that the shutdown process wasn't executed
correctly, maybe due to power failure or system hangs. The percentage
of uptime and downtime reflects that this report is from a lightly
used system:
$ tuptime
System startups:    688   since   22:21:49 09/10/15
System shutdowns:   676 ok   <-   11 bad
System uptime:      4.6 %   -   40 days, 7 hours, 7 minutes
 ↪and 48 seconds
System downtime:    95.4 %   -   2 years, 105 days, 17 hours,
 ↪19 minutes and 25 seconds
System life:        2 years, 146 days, 0 hours, 27 minutes
 ↪and 13 seconds


Largest uptime:     12 hours, 51 minutes and 48 seconds   from
 ↪09:29:18 02/03/16
Shortest uptime:    5 seconds   from   22:20:54 12/02/17
Average uptime:     1 hour, 24 minutes and 21 seconds


Largest downtime:   23 days, 3 hours, 23 minutes and 30 seconds
 ↪from   13:49:42 04/12/16
Shortest downtime:  8 seconds   from   17:08:00 03/01/17
Average downtime:   1 day, 5 hours, 11 minutes and 44 seconds


Current uptime:     1 hour, 50 minutes and 0 seconds   since
 ↪17:37:32 02/07/18
You can change the report to a table format (-t) used in
combination with any
other options, in this case, since the last two startups (-S -2):
$ tuptime -t -S -2
687  14:07:36 02/04/18   1 hour, 28 minutes and 22 seconds
 ↪15:35:58 02/04/18   OK   3 days, 2 hours, 1 minute
 ↪and 34 seconds
688  17:37:32 02/07/18   1 hour, 26 minutes and 13 seconds
Or you can change to the list report format (-l) and show the results
until the second startup (-U 2):
$ tuptime -l -U 2
Startup:  1  at  22:21:49 09/10/15
Uptime:   50 minutes and 44 seconds
Shutdown: OK  at  23:12:33 09/10/15
Downtime: 13 seconds


Startup:  2  at  23:12:46 09/10/15
Uptime:   1 minute and 2 seconds
Shutdown: OK  at  23:13:48 09/10/15
Downtime: 18 hours, 57 minutes and 18 seconds
tuptime also accepts ranges between specific dates using the
tsince and
tuntil options. Both need an argument with the epoch date in seconds. Another
example is a report from the last 365 days until the present, maybe to check
your provider's SLA.
First, get the epoch date of one year ago using the date command:
$ date --date="1 year ago" +%s
1486490845
Next, pass it under tsince to tuptime:
$ tuptime --tsince 1486490845
Here's an example of a report from the first day to the last day of
the previous month in CSV format. Again, use date to get the first and
last days as a timestamp and pass both to tuptime:
$ date -d "-1 month 00:00" +%s
1514761200
$ date -d "this month -1 second 00:00" +%s
1517439599
$ tuptime --tsince 1514761200 --tuntil 1517439599 --csv
Or you can list all the entries (-l) ordered by the uptime
(-o u), instead of
the startup number, in reverse order (-r), including the kernel that was
running (-k):
$ tuptime -l -o u -r -k
The manual has detailed information for every option and includes some interesting notes about sync date and time that can help in case of problems. For more information, see https://github.com/rfrail3/tuptime.git.
—Ricardo Fraile