
tail -F /var/log/messages from multiple servers at
once? Read on. By Fabien WernliTroubleshooting Linux systems can be challenging, especially at times when the tools available to system administrators are constantly evolving. But, it's hard to avoid using some classic utilities on a daily basis. One of them can be summarized by the following command:
tail -F /var/log/messages
Reviewing logs is indeed a key player of the "Utilization Saturation and Errors" (USE) method. While storing historic logs from many servers in a centralized storage engine like Elasticsearch has become quite common nowadays, it's sometimes important to have a low-latency view of what's happening right now in your infrastructure. Unfortunately, there is no standard out-of-the-box tool to view logs in real time simultaneously on all hosts of a data center.
Here are some use cases where low-latency treatment makes sense, along with an example for each:
This article shows how to set up a site-wide low-latency
(sub-millisecond) log shipping infrastructure. I'll do this with minimal
intrusion and demonstrate its usage in the command-line interface, just like
good-old tail -f /var/log/messages.
As your mileage may vary, let's stick to a simple scenario that you can adapt to your own use case. Most instructions given here are for recent Debian-based GNU/Linux distributions, but they easily can be adapted to other environments.
Let's assume a number of Linux or UNIX servers, and that you'd like to be able to subscribe to all or a subset of their logs in real time, using a terminal. Let's refer to these servers as the clients.
Let's further assume that they all have a running syslog collection dæmon, which you'll configure to forward the logs to a remote server that will serve as the log subscription hub.
Finally, you'll use a control node that will serve as the login host. This will be the human-machine interface. The control node can be the same machine as the hub, or you can use your workstation or laptop, provided the firewalls are set up accordingly.
Although no extra software is required on the clients, you'll need the following on the hub:
On the control node, you'll need to install the following:
Before getting your hands dirty modifying configuration files, let's get a glimpse of the big picture. See Figure 1 for a diagram of the overall architecture and event flow.
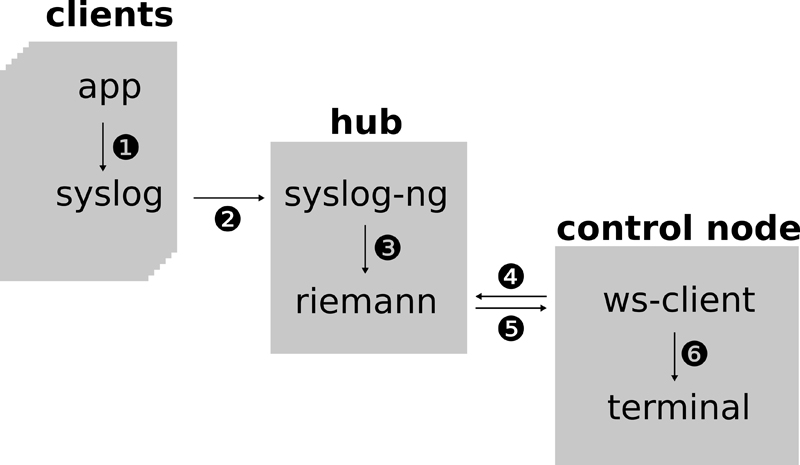
Figure 1. Architecture Diagram
This diagram shows the following:
syslog() to
log a message about an event.
The whole process, from step 1 to 6, usually takes less than a tenth of a millisecond (three sigma), even if tens of thousands of events happen per second.
From the user's perspective, the workflow steps are the following:
ssh to the control node.
Syslog-ng acts as a syslog-forwarder to riemann. Riemann acts as a real-time synchronous event publisher and subscription manager. It can push events matching a certain query using a websocket, for instance, to a command-line client or web browser.
The query must be in riemann's domain-specific language, which is very simple
but quite strict. Basically, you have to remember that riemann events have
tags and attributes. You can query tags using the tagged "foo"
pragma and attributes with key = "value". You can combine
conditions using and and or operators, and use the special
wild-card character "%" in attribute expressions in the following form:
MESSAGE =~ "%quick brown fox%"
You can learn more about queries on the Riemann website. You could, for instance, subscribe to all events having a syslog priority of "warning":
PRIORITY = "warning"
Or subscribe to all events:
true
Or match events from a given IP address:
HOST_FROM = "172.18.0.1"
Clients:
On the clients, you'll need to configure the local syslog dæmon to forward all events to the hub.
The precise method depends on the syslog application you use on the client. If you are using legacy syslogd or rsyslog, add the following line to your (r)syslog.conf file:
* @hub.example.com
If you are using syslog-ng, add the following lines to your syslog-ng.conf file:
destination d_hub {
  network(
    'hub.example.com',
    transport(udp),
    port(514),
    flags(syslog-protocol)
  );
};
And, don't forget to add the new destination to your existing log path (see the Configuration section for an example).
hub:
On the hub, you have more work to do, as you'll be installing and configuring both syslog-ng and riemann. Make sure to download and install at least the versions listed earlier.
The procedure to install syslog-ng highly depends on the operating system you are using. On recent Debian-based GNU/Linux distributions, chances are the distribution packages will contain a recent enough version:
apt install syslog-ng-mod-riemann
If your distribution doesn't provide the required version, the syslog-ng project's home page has pointers to download packages for various platforms. Last but not least, there's always the option of building your own binaries using the source code available on GitHub. If you decide to go down that path, make sure to enable the riemann destination in the compilation options.
Installing riemann is just a matter of downloading the package from its
website and grabbing a copy of a Java Runtime Environment (JRE). On
Debian, the most straightforward option is to install
openjdk-8-jre-headless. You can also build riemann from source (see
instructions on its GitHub
page). On Debian/Stretch, you could do the
following:
apt install openjdk-8-jre-headless
wget https://github.com/riemann/riemann/releases/download/
↪0.3.0/riemann_0.3.0_all.deb
dpkg -i riemann_0.3.0_all.deb
The syslog-ng configuration given here is the minimum required for the task at hand. It doesn't technically conflict with the existing syslog-daemon implementation, unless it's already listening on the UDP port 514. However, on Debian-based distributions, installing syslog-ng will uninstall rsyslog, because the packages conflict with one another.
In this light, you'll add a drop-in file, /etc/syslog-ng/syslog-ng.conf.d/riemann.conf, that syslog-ng will include in the main configuration file. That way, it won't interfere with the configuration file provided in the distribution:
# syslog listener definition on *:514/udp
source s_syslog {
  network(
    ip('0.0.0.0')
    transport(udp)
    port(514)
    flags(syslog-protocol)
  );
};
# riemann destination definition
destination d_riemann {
  riemann(
    server('127.0.0.1')
    port(5555)
    type('tcp')
    ttl('300')
    state("${state:-ok}")
    attributes(
      scope(all-nv-pairs rfc5424)
    )
    tags('syslog')
  );
};
# log path
log {
  source(s_syslog);
  destination(d_riemann);
};
Ensure that the /etc/syslog-ng/syslog-ng.conf file includes the following line; otherwise, syslog-ng will ignore the /etc/syslog-ng/syslog-ng.conf.d/riemann.conf file:
@include "/etc/syslog-ng/conf.d/*.conf"
The above configuration defines a syslog listener on standard UDP port 514, a riemann destination and a log path connecting the two. Refer to the syslog-ng documentation for any details on the syntax used here.
The riemann configuration is given in its entirety. You simply can replace the shipped /etc/riemann/riemann.config with the following:
; Configure logging
(logging/init {:file "/var/log/riemann/riemann.log"})

; Disable riemann's internal instrumentation
(instrumentation {:enabled? false})

; Listen on the local interface over TCP (5555), websockets
; (5556), and server-side-events (5558)
(let [host "0.0.0.0"]
  (tcp-server {:host host :port 5555})
  (ws-server  {:host host :port 5556})
  (sse-server {:host host :port 5558}))

; Expire old events from the index every 5 seconds.
(periodically-expire 5)

; Index all events with a default time-to-live of 60 seconds
(let [index (index)]
  (streams
    (default :ttl 60
      index)))
This configuration sets up three listeners:
It also disables riemann's instrumentation service, so you're not confused with internal messages and can focus only on syslog.
Refer to riemann's resources on the website—especially the how-to section for details on the configuration syntax.
Now that both syslog-ng and riemann are configured to your needs, check the configurations for errors:
syslog-ng -f /etc/syslog-ng/syslog-ng.conf -s
riemann test /etc/riemann/riemann.config
If both return without errors, (re)start the services:
service riemann start
service syslog-ng restart
The last thing you need to connect all the dots is the command-line interface
that will let you tail -F all logs from all the
clients. There
are a number of options here: the CLI you need should support either
websockets or server-side-events. Both are technologies borrowed from the web
that allow the web server (Riemann in this case) to push data to the client,
instead of the client pulling.
You'll be using websockets, as existing software tends to be more generally available. There is a convenient Python package that works right out of the box:
pip install websocket-client
Alternatively, you also can use a Node.js implementation:
npm install -g wscat
Now, subscribe to the syslog flow:
# subscribe to all events (query 'true')
wscat --connect 'ws://hub.example.com:5556/index?subscribe=
↪true&query=true'
# or
wsdump.py -r 'ws://hub.example.com:5556/index?subscribe=
↪true&query=true'
Note that you may have to URL-encode the query:
# subscribe to events matching the query 'PRIORITY = "warning"'
wsdump.py -r 'ws://hub.example.com:5556/index?subscribe=
↪true&query=PRIORITY+%3D+%22warning%22'
Let's push some events to it by crafting a syslog message from another shell:
logger -d -n hub.example.com -p 4 -t foo bar baz
On the WS CLI, you immediately should see:
{"host":"172.18.0.1","service":"test","state":"ok",
↪"description":null,"metric":null,"tags":["syslog"],"time":
↪"2018-04-10T13:36:04.787Z","ttl":300.0,"DATE":"Apr 10
↪15:36:04","HOST":"172.18.0.1","FACILITY":"user","MESSAGE":
↪"bar baz",".SDATA.timeQuality.isSynced":"0","HOST_FROM":
↪"172.18.0.1","SOURCE":"s_syslog",".SDATA.timeQuality.tzKnown":
↪"1","PRIORITY":"warning","PROGRAM":"foo"}
If you want to see a more traditional representation of the message (as in /var/log/messages), you can pipe the client's output through the jq utility in the following way:
wsdump.py -r [...] | jq -r '"\(.time) \(.HOST) \(.PROGRAM)
 ↪\(.MESSAGE)"'
In which case, you'll see:
2018-04-10T14:04:53.489Z 172.18.0.1 foo bar baz
To troubleshoot syslog-ng, run it in the foreground in debug mode:
syslog-ng -Fdv
Although very verbose, the parser and debug messages are extremely valuable when tracking configuration or payload issues.
If needed, feel free to subscribe to the very friendly official mailing list, where many users and also the core developers are active.
Debugging riemann configuration problems can be challenging, especially if you've never programmed in Clojure before. If there is a syntax error, like a missing parenthesis, you quickly can be flooded by Java stack traces. Be patient and try to find the relevant bits in the trace messages.
If that doesn't suffice, there's a very helpful community on IRC and the mailing-list.
Now that you've got a working proof of concept (PoC), there are quite a few things you can do to improve the system. Although I won't go into much detail about those things, here are a few ideas based on our experience at CCIN2P3.
First off, you might want to add a bit of security to the setup. You actually
made things quite worse while moving from ssh+tail -f messages to
the websocket solution. Anyone on the network now can subscribe to the whole
site's syslog, without any authentication. Luckily, there's a simple
solution to this: set up a reverse proxy in front of riemann's websocket
listener. As authentication is very site-specific, I won't cover it
extensively here. However, here's a simple example using the Caddy web server
and basic authentication:
# /etc/Caddyfile
hub.example.com:5559 {
  tls self_signed
  basicauth / user pass
  proxy / localhost:5556 {
    websocket
  }
}
This configuration will listen to the external port 5559 and proxy the traffic to local port 5556 if the user provided correct credentials. This only makes sense if riemann is reconfigured to listen on the local network interface.
On the control node, you now can connect to the proxy using basic authentication:
wsdump.py --headers 'Authorization: Basic dXNlcjpwYXNz' -r
 ↪'wss://hub.example.com:5559/index?subscribe=true&query=true' -n
# or
wscat -n --auth user:pass --connect 'wss://hub.example.com:5559/
↪index?subscribe=true&query=true'
Note that the Python CLI doesn't support supplying basic auth credentials on
the command line, so you need to pass the base64 encoded
user:pass using
an HTTP header.
Another improvement could be to write a higher-level CLI that integrates with your local organization's central authentication mechanisms. For example, it could leverage roles from a central identity directory and apply access control lists. Those could be host-based or even application-based: role A can subscribe to events matching queries X, Y and Z.
Both software suites installed on the hub can be leveraged further to filter, aggregate and even correlate syslog messages.
Although syslog-ng can do this in a more traditional fashion by using configuration elements like filters, parsers and template functions, riemann on the other hand gives you full control over the event flow. In fact, its configuration file is code that will be compiled, so you can do virtually anything. One of the most common usages in the wild for both software packages are structuring incoming data. Although you saw that syslog events already feature some structure in the form of key/value pairs, both riemann and syslog-ng can help you extract or add additional features to your events. Those will help you filter the live stream of events and answer real questions.
There is a web interface (riemann-dash) that takes advantage of riemann's subscription mechanism. It can display events in textual, grid or even graphical form, and it's invaluable when you want to monitor changes in real time in a distributed application.
Another caveat of this PoC is that this hub is a single point of failure (SPoF). You could do the following to improve the situation:
For your convenience, a GitHub repository containing the means to build a Docker container for the solution described in this article is at your disposal. It includes the steps on how to build, run and use the container.
Further Reading:
Fabien Wernli (faxm0demi/faxmodem on GitHub, Twitter and Freenode) has been administering Linux clusters at the Computing Centre of the National Institute of Nuclear Physics and Particle Physics (CC-IN2P3) for 15 years. Among other things, he is an expert on performance-data monitoring and infrastructure management.
