 |  |

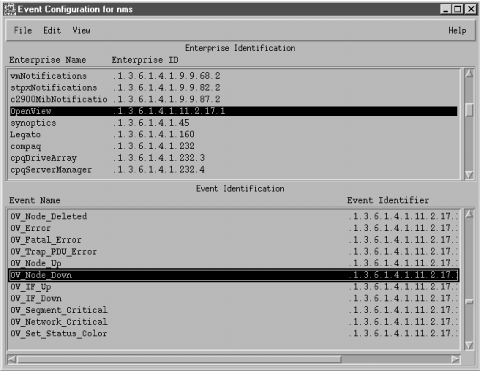
 Event Configurations" (on the NNM GUI) or by giving the
command $OV_BIN/xnmtrap. In the Enterprise
Identification window, scroll down and click on the enterprise name
"OpenView .1.3.6.1.4.1.11.2.17.1." This displays a list
in the Event Identification window. Scroll down in this list until
you reach "OV_Node_Down." Double-click on this event to
bring up the Event Configurator (Figure 10-1).
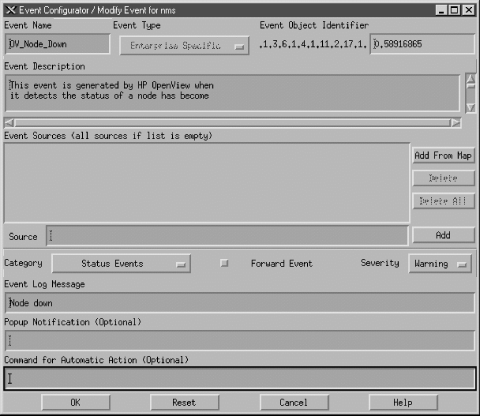
[42]This is the default number that OpenView uses for this OV_Node_Down trap.
[43]Again, in earlier releases of OpenView this log was located in $OV_LOG/trapd.log. New versions use the OpenView Event Database. This is backward-compatible using the ovdumpevents command to produce a " trapd.log file.
TIP: Log only" is useful if you have some events that are primarily informational; you don't want to see them when they arrive, but you would like to record them for future reference. The Cisco event frDLCIStatusChange - .1.3.6.1.2.1.10.32.0.1 is a good example of such an event. It tells us when a Virtual Circuit has changed its operational state. If displayed, we will see notifications whenever a node goes down and whenever a circuit changes its operational state to down. This information is redundant because we have already gotten a status event of "node down" and a DLCI change.[44] With this event set to "Log only" we can go to the log file only when we think things are fishy.[44]Newer versions of OpenView have a feature called Event Correlation that groups certain events together to avoid flooding the user with redundant information. You can customize these settings with a developer's kit.
| Severity | Color |
|---|---|
| Unknown | Blue |
| Normal | Green |
| Warning | Cyan |
| Minor | Yellow |
| Major | Orange |
| Critical | Red |
The colors are used both on OpenView's maps and in the Event Categories. Parent objects, which represent the starting point for a network, are displayed in the color of the highest severity level associated with any object underneath them.[45] For example, if an object represents a network with 250 nodes and one of those nodes is down (a Critical severity), the object will be colored red, regardless of how many nodes are up and functioning normally. The term for how OpenView displays colors in relation to objects is status source ; it is explained in more detail in Chapter 6, "Configuring Your NMS".
[45]Parent objects can show status (colors) in four ways: Symbol, Object, Compound, or Propagated.
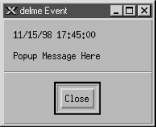
WARNING: Before you start running scripts for an event, find out the average number of traps you are likely to receive for that event. This is especially true for OV_Node_Down. If you write a script that opens a trouble ticket whenever a node goes down, you could end up with hundreds of tickets by the end of the day. Monitoring your network will make you painfully aware of how much your network "flaps," or goes up and down. Even if the network goes down for a second, for whatever reason, you'll get a trap, which will in turn generate an event, which might register a new ticket, send you a page, etc. The last thing you want is "The Network That Cried Down!" You and other people on your staff will start ignoring all the false warnings and may miss any serious problems that arise. One way to estimate how frequently you will receive events is to log events in a file ("Log only"). After a week or so, inspect the log file to see how many events accumulated (i.e., the number of traps received). This is by no means scientific, but it will give you an idea of what you can expect.
 Edit
Edit  Configure
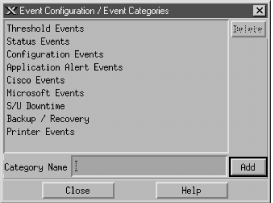
 Event Categories." Figure 10-3 shows
this menu, with some custom categories added.
It's fairly obvious what these lines do: they map a particular RMON event into the Threshold Events category with a severity of Warning; they also specify what should happen when the event occurs. To map this event into another category, change Threshold Events to the appropriate category. Once you've edited the file, use the following command to merge in your updates:EVENT RMON_Rise_Alarm .1.3.6.1.2.1.16.0.1 "Threshold Events" Warning FORMAT RMON Rising Alarm: $2 exceeded threshold $5; value = $4. (Sample type = \ $3; alarm index = $1) SDESC This event is sent when an RMON device exceeds a preconfigured threshold. EDESC
$ $OV_BIN/xnmevents -l load /tmp/trapd.conf
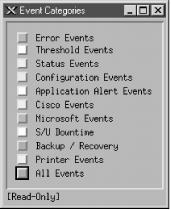
 Events" menu item or
by issuing the command $OV_BIN/xnmevents. The menu
displays all the event categories, including any categories you have
created. Two categories are special: the Error category is the
default category used when an event is associated with a category
that cannot be found; the All category is a placeholder for all
events and cannot be configured by the Event Configurator. The window
shows you the highest severity level of any event in each event
category.
The box to the left of
Status Events is cyan (a light blue), showing that the highest
unacknowledged severity in the Status Events category is Warning.
Clicking on that box displays an alarm browser that lists all the
events received in the category. A nice feature of the Event
Categories display is the ability to restore a browser's state
or reload events from the trapd.log and
trapd.log.old files. Reloading events is useful
if you find that you need to restore messages you deleted in the
past.
TIP: Newer versions of OpenView extend the abilities of Event Categories by keeping a common database of acknowledged and unacknowledged events. Thus, when a user acknowledges an event, all other users see this event updated.At the bottom of Figure 10-4, the phrase "[Read-Only]" means that you don't have write access to Event Categories. If this phrase isn't present, you have write access. OpenView keeps track of events on a per-user basis, using a special database located in $OV_LOG/xnmevents.username.[46] With write access, you have the ability to update this file whenever you exit. By default, you have write access to your own event category database, unless someone has already started the database by starting a session with your username. There may be only one write-access Event Categories per user, with the first one getting write access and all others getting read-only privileges.
[46]Again, newer versions of OpenView have only one database that is common for all users.

[47]Newer versions of OpenView support Event Correlation, which has a column in this window as well.The Actions menu in the alarm browser allows you to acknowledge, deacknowledge, or delete some or all events. You can even change the severity of an event. Keep in mind that this does not change the severity of the event on other Event Categories sessions that are running. For example, if one user changes the severity of an event from Critical to Normal, the event will remain Critical for other users. The View menu lets you define filters, which allow you to include or discard messages that match the filter. When configuring events, keep in mind that you may receive more traps than you want. When this happens, you have two choices. First, you can go to the agent and turn off trap generation, if the agent supports this. Second, you can configure your trap view to ignore these traps. We saw how to do this earlier: you can set the event to "Log only" or try excluding the device from the Event Sources list. If bandwidth is a concern, you should investigate why the agent is sending out so many traps before trying to mask the problem.
 Add
Add  Enterprise Identification"
and insert your enterprise name and a registered enterprise
ID.[48] Now you're ready to create private events. Click on
the enterprise name you just created; the enterprise ID you've
associated with this name will be used to form the OID for the new
event. Click "Edit
  Add
Add  Event"; then type
the Event Name for your new event, making sure to use Enterprise
Specific (the default) for the event type. Insert an Event Object
Identifier. This identifier can be any number that hasn't
already been assigned to an event in the currently selected
enterprise. Finally, click "OK" and save the event
configuration (using "File
  Save").
[48]Refer to Chapter 2, "A Closer Look at SNMP" for information about obtaining your own enterprise ID.To copy an existing event, click on the event you wish to copy and select "Edit
 Copy Event"; you'll see a new
window with the event you selected. From this point on, the process
is the same.
Traps with "no format"
are traps for which nothing has been defined in the Event
Configuration window. There are two ways to solve this problem: you
can either create the necessary events on your own or you can load a
MIB that contains the necessary trap definitions, as discussed in
Chapter 6, "Configuring Your NMS". "No format" traps
are frequently traps defined in a vendor-specific MIB that
hasn't been loaded. Loading the appropriate MIB often fixes the
problem by defining the vendor's traps and their associated
names, IDs, comments, severity levels, etc.
TIP: Before loading a MIB, review the types of traps the MIB supports. You will find that most traps you load come, by default, in LOGONLY mode. This means that you will not be notified when the traps come in. After you load the MIB you may want to edit the events it defines, specifying the local configuration that best fits your site.
#!/usr/local/bin/perl

use SNMP_Session "0.60";
use BER;
use Socket;
$session = SNMPv1_Session->open_trap_session (  );

while (($trap, $sender, $sender_port) = $session->receive_trap (  ))
{
    chomp ($DATE=`/bin/date \'+%a %b %e %T\'`);
    print STDERR "$DATE - " . inet_ntoa($sender) . " - port: $sender_port\n";
    print_trap ($session, $trap);
}
1;

sub print_trap ($$) {
    ($this, $trap) = @_;
    ($community, $ent, $agent, $gen, $spec, $dt, @bindings) = \
     $this->decode_trap_request ($trap);
    print "   Community:\t".$community."\n";
    print "   Enterprise:\t".BER::pretty_oid ($ent)."\n";
    print "   Agent addr:\t".inet_ntoa ($agent)."\n";
    print "   Generic ID:\t$gen\n";
    print "   Specific ID:\t$spec\n";
    print "   Uptime:\t".BER::pretty_uptime_value ($dt)."\n";
    $prefix = "   bindings:\t";
    foreach $encoded_pair (@bindings)
		{
        ($oid, $value) = decode_by_template ($encoded_pair, "%{%O%@");
        #next unless defined $oid;
        print $prefix.BER::pretty_oid ($oid)." => ".pretty_print ($value)."\n";
        $prefix = "  ";
		}
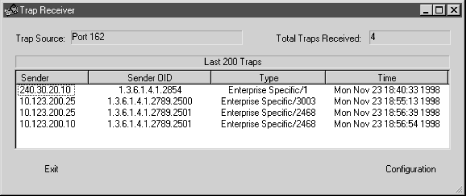
}The output format is the same for both traps. The first line shows the date and time at which the trap occurred, together with the IP address of the device that sent the trap. Most of the remaining output items should be familiar to you. The bindings output item lists the variable bindings that were sent in the trap PDU. In the example above, each trap contained one variable binding. The object ID is in numeric form, which isn't particularly friendly. If a trap has more than one variable binding, this program displays each binding, one after another. An ad hoc monitoring system can be fashioned by using this Perl script to collect traps and some other program to inspect the traps as they are received. Once the traps are parsed, the possibilities are endless. You can write user-defined rules that watch for significant traps and, when triggered, send an email alert, update an event database, send a message to a pager, etc. These kinds of solutions work well if you're in a business with little or no budget for commercially available NMS software or if you're on a small network and don't need a heavyweight management tool.Mon Apr 28 22:07:44 - 10.123.46.26 - port: 63968 community: public enterprise: 1.3.6.1.4.1.2789.2500 agent addr: 10.123.46.26 generic ID: 6 specific ID: 5247 uptime: 0:00:00 bindings: 1.3.6.1.4.1.2789.2500.1234 => 14264026886 Mon Apr 28 22:09:46 - 172.16.51.25 - port: 63970 community: public enterprise: 1.3.6.1.4.1.2789.2500 agent addr: 172.16.253.2 generic ID: 6 specific ID: 5247 uptime: 0:00:00 bindings: 1.3.6.1.4.1.2789.2500.2468 => Hot Swap Now In Sync
[49]This software can be found on their web page at http://www.ncomtech.com.
$ ./snmptrapd -P
2000-12-13 19:10:55 UCD-SNMP Version 4.1.2 Started.
2000-12-13 19:11:14 sunserver2.ora.com [12.1.45.26] enterprises.2789.2500:
        Enterprise Specific Trap (1224) Uptime: 5 days, 10:01:20.42
        enterprises.2789.2500.1224 = 123123

2000-12-13 19:11:53 sunserver2.ora.com [12.1.45.26] enterprises.2789.2500:
        Enterprise Specific Trap (1445) Uptime: 5 days, 10:01:21.20
        enterprises.2789.2500.1445 = "Fail Over Complete"
Copyright © 2002 O'Reilly & Associates. All rights reserved.